


Ons team heeft meer dan 7,000,000 handelaren!
Elke dag werken we samen om de handel te verbeteren. We behalen hoge resultaten en gaan verder.
Erkenning door miljoenen handelaren over de hele wereld is de beste waardering voor ons werk! U heeft uw keuze gemaakt en wij zullen er alles aan doen om aan uw verwachtingen te voldoen!
Wij zijn samen een geweldig team!
InstaSpot. Trots om voor je te werken!


Acteur, UFC 6-toernooikampioen en een echte held!
De man die zichzelf heeft gemaakt. De man die onze kant op gaat.
Het geheim achter het succes van Taktarov is een constante beweging naar het doel.
Onthul alle kanten van je talent!
Ontdekken, proberen, falen - maar nooit stoppen!
InstaSpot. Je succesverhaal begint hier!

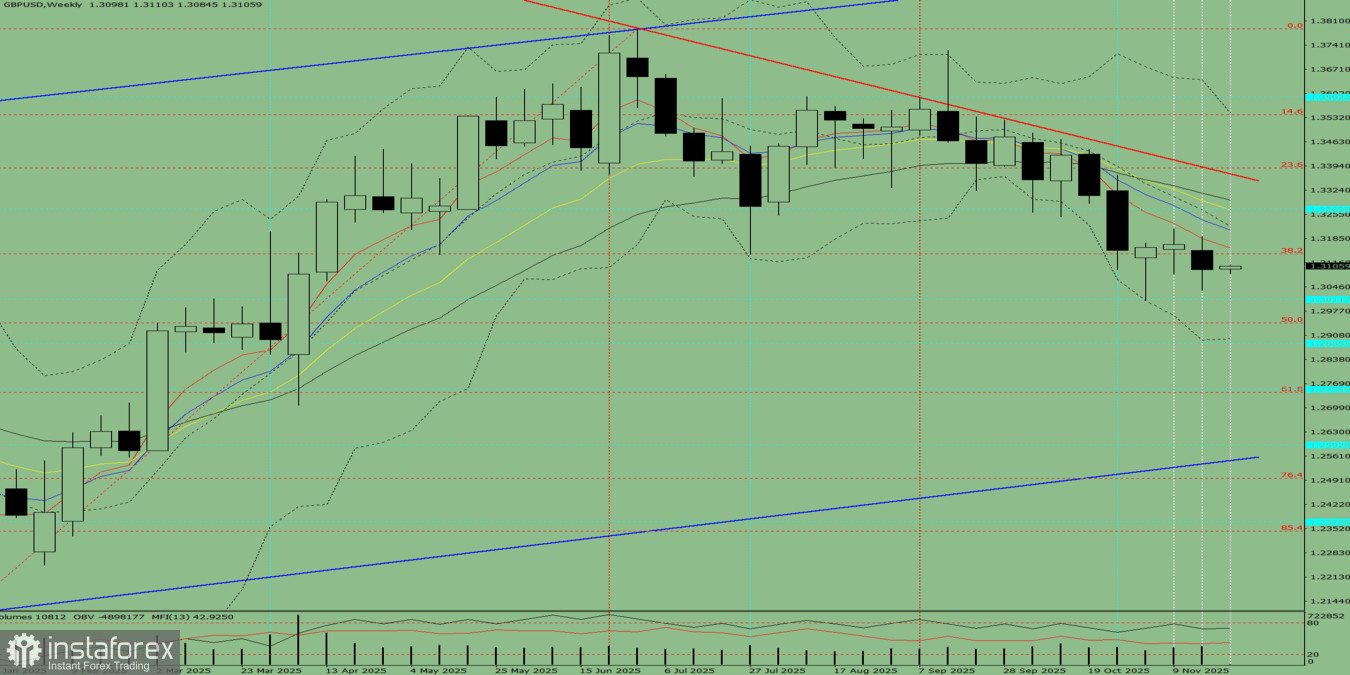
Trend Analysis.
This week, the price at the level of 1.3096 (the closing of the last weekly candle) may begin to move upwards with a target of 1.3270 – a historical resistance level (blue dashed line). When testing this level, the price may pull back down to a target of 1.3224 – the 8-period EMA (blue thin line).
Comprehensive Analysis:
Conclusion from Comprehensive Analysis: Upward trend.
Overall assessment of the GBP/USD weekly candle calculation: the price is most likely to have an upward trend this week, with the absence of a first lower shadow on the weekly white candle (Monday – upward) and the presence of a second upper shadow (Friday – downward).
Alternative Scenario: The price from the level of 1.3096 (the closing of the last weekly candle) may begin to move upward with a target of 1.3224 – the 8-period EMA (blue thin line). Upon reaching this line, a downward price movement to the target of 1.3142 – the 38.2% retracement level (red dashed line) is possible.
*The market analysis posted here is meant to increase your awareness, but not to give instructions to make a trade.
InstaSpot analytical reviews will make you fully aware of market trends! Being an InstaSpot client, you are provided with a large number of free services for efficient trading.


