




Ons team heeft meer dan 7,000,000 handelaren!
Elke dag werken we samen om de handel te verbeteren. We behalen hoge resultaten en gaan verder.
Erkenning door miljoenen handelaren over de hele wereld is de beste waardering voor ons werk! U heeft uw keuze gemaakt en wij zullen er alles aan doen om aan uw verwachtingen te voldoen!
Wij zijn samen een geweldig team!
InstaSpot. Trots om voor je te werken!





Acteur, UFC 6-toernooikampioen en een echte held!
De man die zichzelf heeft gemaakt. De man die onze kant op gaat.
Het geheim achter het succes van Taktarov is een constante beweging naar het doel.
Onthul alle kanten van je talent!
Ontdekken, proberen, falen - maar nooit stoppen!
InstaSpot. Je succesverhaal begint hier!

The 4-hour (H4) chart for Gold (GOLD) reveals a clear positive shift in price action. The price is currently trading at the 4366.80 level, having successfully broken out of the bearish corrective range and stabilized above it, driven by increased buying pressure.
Technical Reading and Price Action
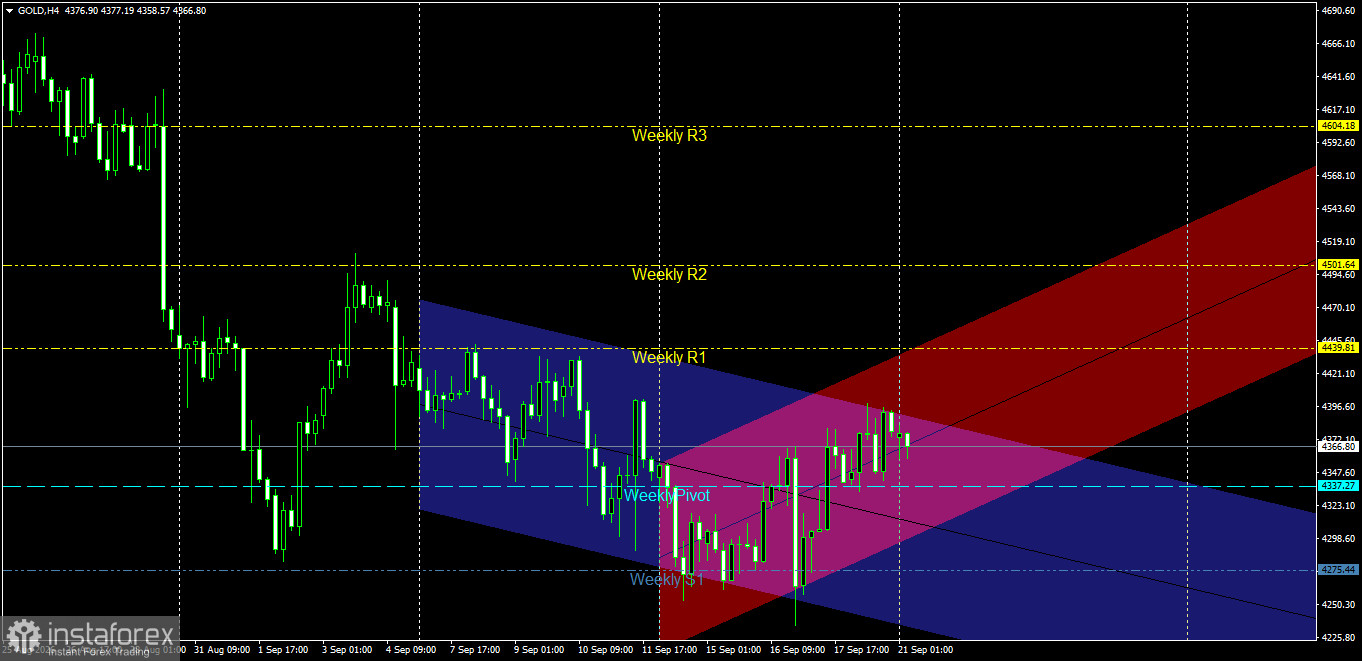
Price Channel Structure: Gold is moving within a primary bullish channel (blue) that reflects the prevailing trend, alongside a steeper secondary bullish channel (pink). The price previously surged to record a local high near the 4400.00 level before entering a profit-taking phase that pulled it down toward the midline of the primary channel.
Interaction with Pivot Levels and Pending Orders: The price is currently trading above the Weekly Pivot level (4337.27), which serves as a key support zone where buyers are stepping in to prevent further decline. The chart also indicates an open buy position (0.01 lots) near 4353.60, targeting a take-profit (TP) level at 4381.85, with a stop-loss (SL) order placed below the Weekly Pivot at 4325.35.
Pivotal Support and Resistance Levels
Key Resistance Levels:
Resistance 1: 4381.85 (intraday resistance level and the designated take-profit target).
Resistance 2: The previous peak range near 4400.00 – 4406.00. Key Support Levels:
First Support: 4337.27 (Weekly Pivot and the primary support for the current movement).
Second Support: 4325.35 (Defined stop-loss zone and the lower boundary of the pink channel).
Key Support: 4275.44 (Weekly S1 and the previous pivotal low).
Price Action Outlook and Trading Recommendations
Bullish Scenario (Primary):
The positive scenario is considered the most likely as long as the price maintains trading above the weekly pivot point (4337.27) and remains within the blue channel.
Recommendation: Hold existing long positions from the 4350.00–4353.00 zone, or buy upon a bounce from the pivot.
Technical Targets: Target the 4381.85 level as the primary objective; a breakout here opens the door for an extension toward 4400.00.
Stop-Loss: Place the stop-loss order precisely below the weekly pivot level at 4325.35.
Bearish Corrective Scenario (Alternative):
This scenario is triggered if the price faces selling pressure that breaks the pivot level and pushes it below the bullish channels.
Validation Condition: Breaking the 4337.27 level and closing below 4325.35 on a full one-hour candle.
Technical Targets: A pullback to retest the next support zones, moving toward 4275.44. Risk Management
It is recommended to manage the size of open positions in proportion to your trading account size and to adhere to the stop-loss level at 4325.35 to protect capital against any sudden market volatility.
*The market analysis posted here is meant to increase your awareness, but not to give instructions to make a trade.
InstaSpot analytical reviews will make you fully aware of market trends! Being an InstaSpot client, you are provided with a large number of free services for efficient trading.


