




Ons team heeft meer dan 7,000,000 handelaren!
Elke dag werken we samen om de handel te verbeteren. We behalen hoge resultaten en gaan verder.
Erkenning door miljoenen handelaren over de hele wereld is de beste waardering voor ons werk! U heeft uw keuze gemaakt en wij zullen er alles aan doen om aan uw verwachtingen te voldoen!
Wij zijn samen een geweldig team!
InstaSpot. Trots om voor je te werken!





Acteur, UFC 6-toernooikampioen en een echte held!
De man die zichzelf heeft gemaakt. De man die onze kant op gaat.
Het geheim achter het succes van Taktarov is een constante beweging naar het doel.
Onthul alle kanten van je talent!
Ontdekken, proberen, falen - maar nooit stoppen!
InstaSpot. Je succesverhaal begint hier!

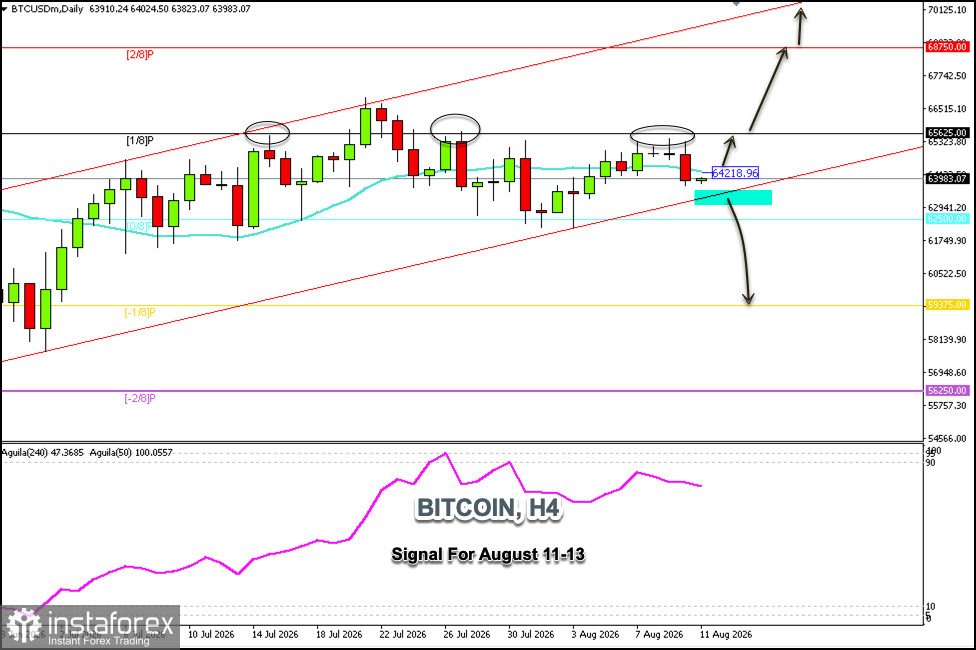
Bitcoin is trading around $63,983, below the 21-day SMA and within an uptrend channel that has been forming since early July. On the daily chart, we can see that Bitcoin is struggling to break above the $65,625 zone, as it has been attempting to do so over the past week but has been unsuccessful.
Today's daily chart shows a decline in Bitcoin, and there could be a sharp downward acceleration if there is a decisive break below the uptrend channel. If this occurs, we could expect it to reach $62,500 and potentially even hit the psychological level of $60,000.
Conversely, if Bitcoin consolidates above $64,218 in the coming hours, we could expect a recovery, and there could be strong momentum to push above $65,600, as this level acts as a key support for BTC.
If Bitcoin quickly surpasses $65,625 in the coming days, it could reach the 2/8 Murray level around $68,750 and might even hit the psychological level of $70,000, which would coincide with the upper band of the uptrend channel.
We should monitor Bitcoin's price movement closely in the coming hours; a drop below $63,000 could change Bitcoin's outlook and potentially trigger a bearish cycle, while a move above $65,000 could signal a further uptrend.
*The market analysis posted here is meant to increase your awareness, but not to give instructions to make a trade.
InstaSpot analytical reviews will make you fully aware of market trends! Being an InstaSpot client, you are provided with a large number of free services for efficient trading.


