


हमारी टीम के पास 7,000,000 से अधिक ट्रेडर हैं!
प्रतिदिन हम ट्रेडिंग को बेहतर बनाने के लिए एक साथ काम करते हैं। हम उच्च परिणाम प्राप्त कर रहे हैं और आगे की ओर बढ़ रहे हैं।
दुनियाभर के लाखों लोगों द्वारा हमारे काम को पहचानना, हमारे काम की सबसे अच्छी सराहना है! आपने आपनी पसंद बनाई है और हम आपकी अपेक्षाओं को पूरा करने के लिए हर संभव प्रयास करेंगे!
हम एक साथ एक अच्छी टीम हैं!
इंस्टाफॉरेक्स को इस बात का गर्व है कि वह आपके लिए काम कर रहा है!


एक्टर, यूएफसी 6 टूर्नामेंट का विजेता और एक सच्चा हीरो!
वह आदमी, जिसने अपनी मेहनत से सब किया है। वह आदमी, जो हमारे रास्तों पर चलता है.
टैक्टारोव की सफलता का राज लक्ष्य की ओर लगातर अग्रसर रहना है।
अपनी प्रतिभा के सभी पक्षों को प्रकट करें!
खोज करें, कोशिश करें, विफल हो-लेकिन कभी न रूकें!
इंस्टाफॉरेक्स- हमारी सफलताओं की कहानी यहाँ से शुरू होती है!

The EUR/USD currency pair continued its upward movement on Tuesday, with the move not objectively triggered by local macroeconomic or fundamental events. It was not driven even by geopolitical events. Reports continue to come from the Middle East and the White House, which are not at all in line with the concepts of "de-escalation" and "ending the conflict." Specifically, Donald Trump on Monday announced his own blockade of the Strait of Hormuz, which is hardly a positive development. However, the two-week ceasefire continues, and so far, neither side of the conflict has violated it. Rumor has it that negotiations may resume this week, which is a positive sign. Better unpromising talks than continuing the war. We believe the euro has been rising for over a week because the shelf life of geopolitics has expired. We have repeatedly warned that the dollar cannot and will not continue to rise solely on the basis of one factor. There are simply no other growth factors for it.
In technical terms, the upward trend continues without any doubt. It is difficult to say how long the euro's rise will last, but traders currently have technical benchmarks to react to changes in market sentiment. If the war in the Middle East resumes, the dollar may resume growth, but we continue to expect the upward trend to continue in 2025 in any case.
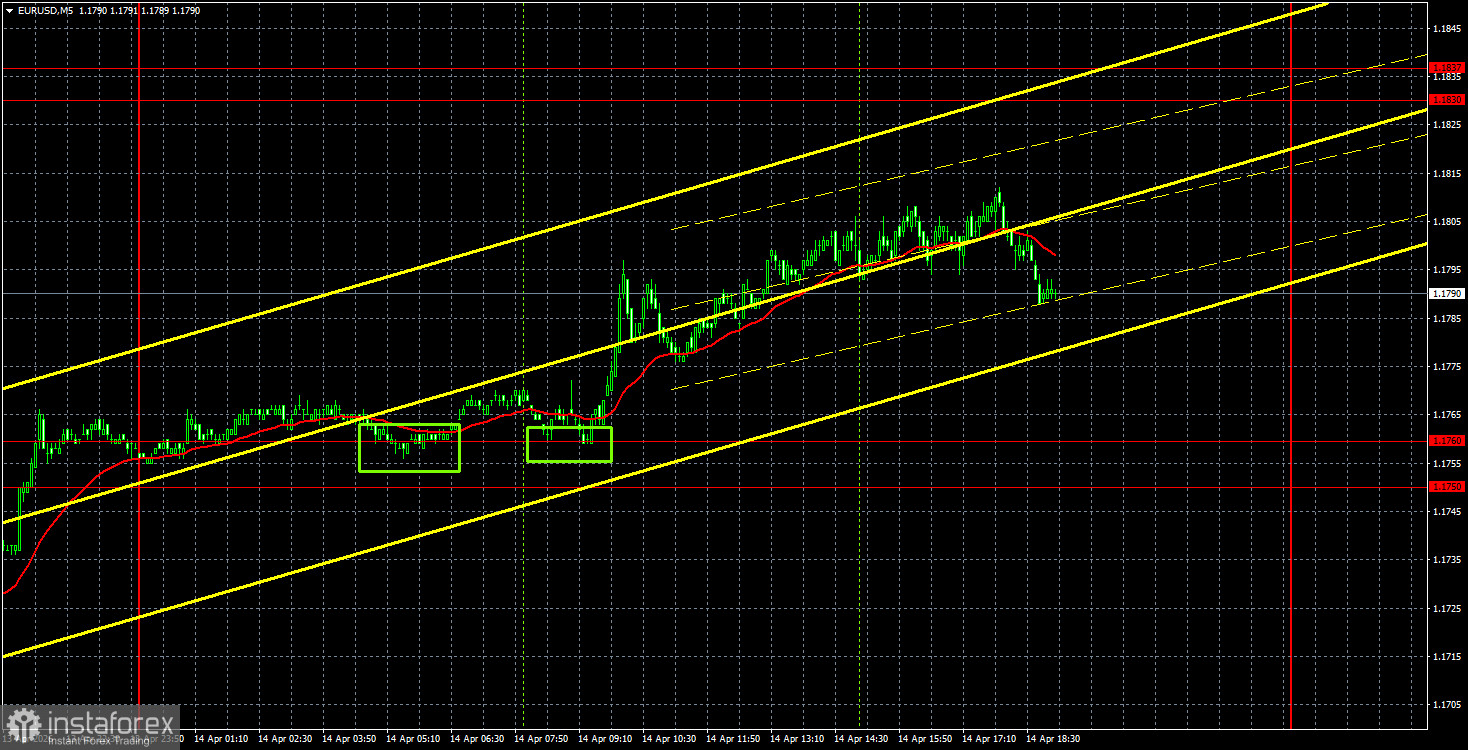
In yesterday's 5-minute timeframe, two buy signals were generated. The price rebounded twice from the area of 1.1750-1.1760, providing traders with two opportunities to open long positions at the very beginning of the European trading session. By the end of the day, the pair moved up about a minimum of 25 pips, which could have been earned quite easily.
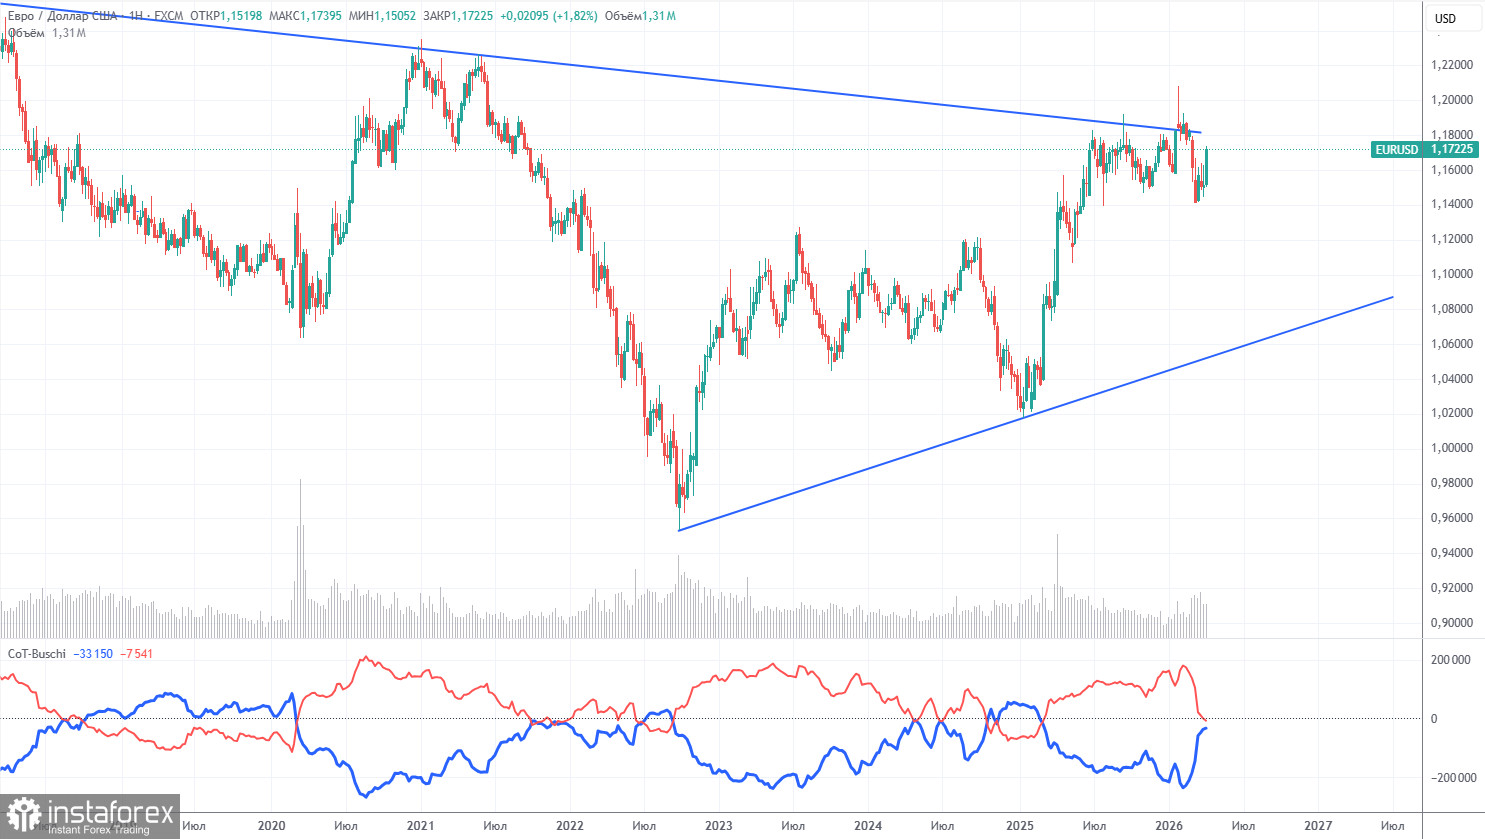
The latest COT report is dated April 7. The illustration for the weekly timeframe clearly shows that the net position of non-commercial traders remains "bullish," but is rapidly declining amid geopolitical events. Traders are massively shedding the euro in favor of the U.S. dollar. Donald Trump's policy has not changed, but the dollar now serves as a "reserve currency," ensuring strong demand for it.
We see no fundamental factors that would strengthen the euro; however, there are plenty that would weaken the dollar. The war in the Middle East temporarily made the dollar super-attractive, but once this factor's "shelf life" expires, everything will return to normal. In the long term, the euro may fall to 1.06 (the trendline), but the upward trend will remain intact. Currently, the pair has not deviated significantly from the descending trend line, which has been broken several times.
The position of the red and blue lines of the indicator indicates parity between bulls and bears. Over the last reporting week, the number of longs among the "Non-commercial" group increased by 800, while the number of shorts increased by 8,800. Accordingly, the net position decreased by another 8,000 contracts over the week.
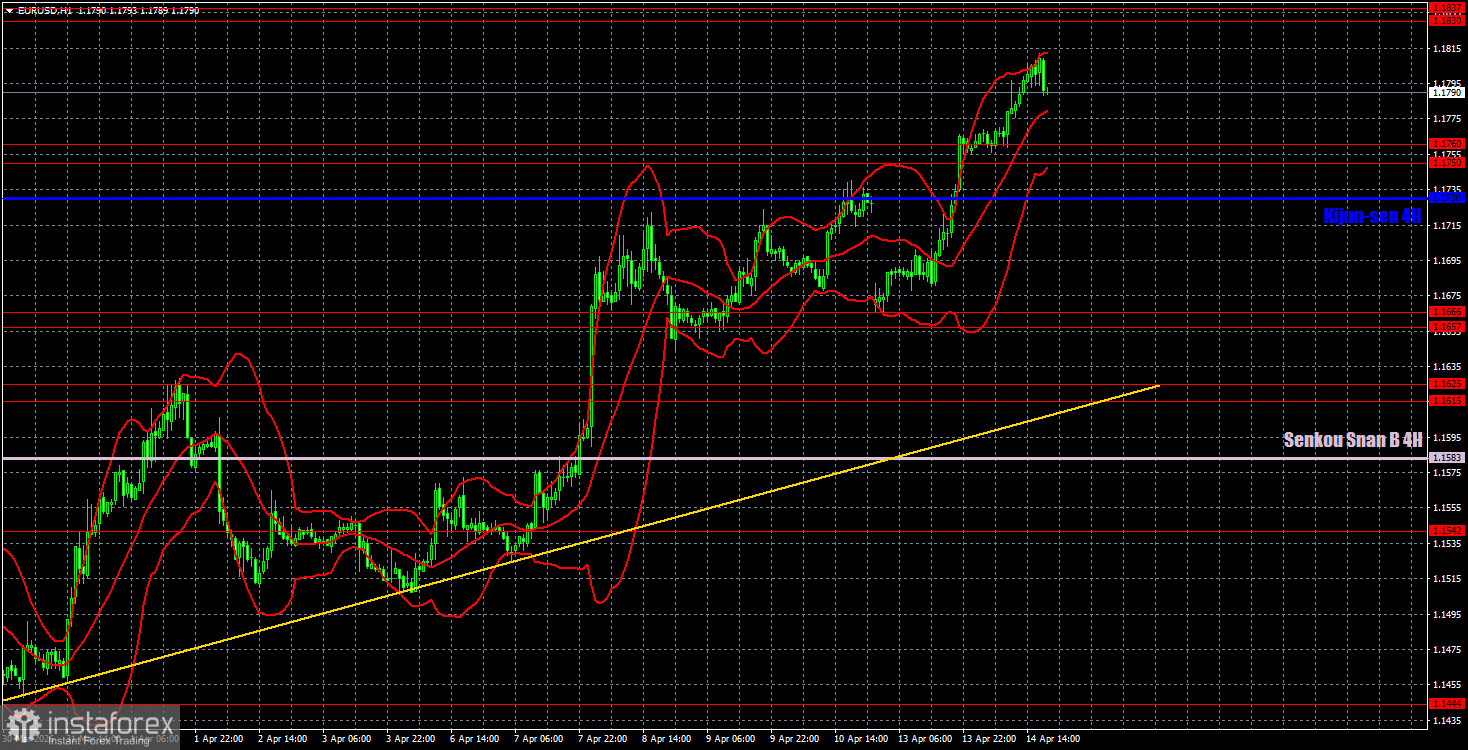
On the hourly timeframe, the EUR/USD pair continues its upward trend. A new escalation in the Middle East could once again shift traders' priorities; thus, any growth in the pair should be approached cautiously. At the same time, the situation in the Middle East remains stably tense but is not deteriorating, so there are also few compelling reasons for the U.S. dollar to strengthen further. Currently, there are no technical grounds to expect a decline.
On April 15, we identified the following levels for trading: 1.1362, 1.1426, 1.1542, 1.1615-1.1625, 1.1657-1.1666, 1.1750-1.1760, 1.1830-1.1837, 1.1907-1.1922, as well as the Senkou Span B line (1.1583) and Kijun-sen line (1.1730). The Ichimoku indicator lines may move throughout the day, which should be taken into account when determining trading signals. Don't forget to set the Stop Loss order to breakeven if the price has moved in the right direction by 15 pips. This will protect against potential losses if the signal turns out to be false.
On Wednesday, a report on industrial production will be published in the European Union, and ECB President Christine Lagarde will also give another speech. In the U.S., the event calendar is essentially empty.
On Wednesday, traders may consider short positions if the price rebounds from the 1.1830-1.1837 area, targeting 1.1750-1.1760. Long positions can be held towards the target of 1.1750-1.1760, as the price rebounded from the 1.1657-1.1666 area. New long positions can be opened upon consolidation above the area of 1.1830-1.1837.
Support and resistance price levels are thick red lines around which the movement may end. They are not sources of trading signals.
The Kijun-sen and Senkou Span B lines are lines of the Ichimoku indicator, transferred to the hourly timeframe from the 4-hour timeframe. They are strong lines.
Extreme levels are thin red lines from which the price previously rebounded. They are sources of trading signals.
Yellow lines are trend lines, trend channels, and any other technical patterns.
Indicator 1 on the COT charts shows the size of the net position of each category of traders.
*यहां पर लिखा गया बाजार विश्लेषण आपकी जागरूकता बढ़ाने के लिए किया है, लेकिन व्यापार करने के लिए निर्देश देने के लिए नहीं |
InstaSpot analytical reviews will make you fully aware of market trends! Being an InstaSpot client, you are provided with a large number of free services for efficient trading.


