




Legenda tim InstaSpot!
Legenda! Anda pikir legenda adalah retorika yang bombastis? Lalu, bagaimana menyebut seorang pria, seorang Asia pertama yang memenangkan kejuaraan catur dunia junior pada usia 18 tahun, dan yang menjadi Grandmaster India pertama pada usia 19 tahun? Itulah awal perjalanan yang sulit dalam meraih gelar Juara Dunia bagi Viswanathan Anand, pria yang menjadi bagian dari sejarah catur untuk selamanya. Sekarang, satu lagi legenda masuk ke dalam tim InstaSpot!





Borussia merupakan salah satu klub sepakbola paling terkenal di Jerman, yang telah berulang kali membuktikan pada para penggemarnya: semangat kompetisi dan kepemimpinan pasti akan mengarah pada kesuksesan. Lakukan trading dengan cara yang sama seperti para profesional olahraga: percaya diri dan aktif. Gunakan "kunci" dari Borussia FC dan jadilah yang terdepan bersama InstaSpot!

Today, gold has entered consolidation after a four-day rally triggered by the unexpected intervention by the U.S. Treasury in the bond market. The metal fell 0.4 percent to $4,632.75 per ounce, although it had traded around $4,700 earlier amid volatile trading. Silver fell by 1.5 percent to $67.93, while platinum and palladium also decreased in price.
The reason for the rally lies not in the classic logic of yields but in the undermining of confidence in American finances. Recent attempts to control the cost of servicing the national debt have renewed investors' concerns regarding inflation and the dollar, making the dollar-denominated metal cheaper for many buyers and signaling the return of the depreciation theme that fueled last year's rapid gold rally.
Yesterday, Treasury Secretary Scott Bessent, who had previously expressed readiness to expand the buyback of more expensive debt issues, unexpectedly refrained from further signals on Monday. This has caused gold to lose some of its advantage, and the focus has shifted to Kevin Warsh's speech on Friday in Jackson Hole, where the Federal Reserve chair will need to clarify his views on how the central bank should respond to persistent inflation.
A notable example of how institutional investors interpret the situation is Fidelity's decision to double its gold holdings in the fund over the past three weeks. The company has reported that it began accumulating after investors exited long-term Treasury bonds following the Fed's July meeting, when the central bank left the rate unchanged. In other words, the catalyst for large-scale capital flows was uncertainty surrounding Fed policy rather than any single economic indicator.
The noticeable rebound over the past few weeks has pushed the metal above its 200-day moving average, often interpreted as a bullish technical signal.
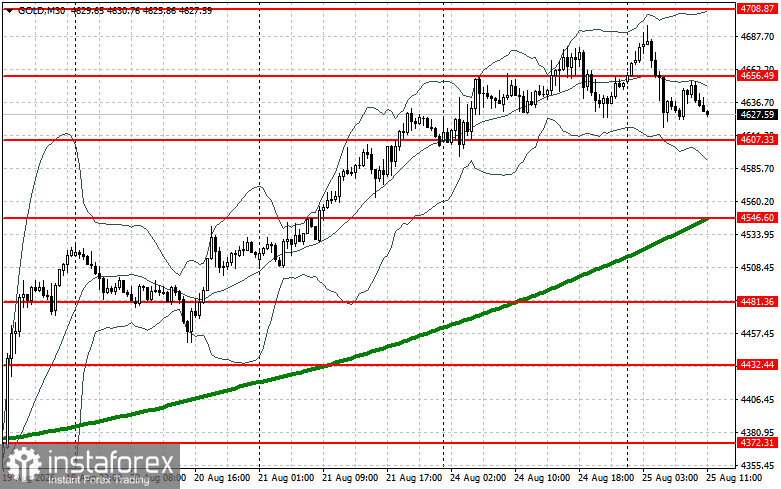
As for the current technical picture of gold, buyers need to take out the nearest resistance at $4,656. This will allow them to target $4,708, above which it will be quite challenging to break through. The furthest target will be around $4,738. In the event of a decline in gold, bears will attempt to regain control over $4,607. If successful, a breakout from this range would inflict serious damage on bullish positions and push gold down to a low of $4,546, with the prospect of reaching $4,481.
*Analisis pasar yang diposting disini dimaksudkan untuk meningkatkan pengetahuan Anda namun tidak untuk memberi instruksi trading.
Tinjauan analitis InstaSpot akan membuat Anda menyadari sepenuhnya tren pasar! Sebagai klien InstaSpot, Anda dilengkapi dengan sejumlah besar layanan gratis untuk trading yang efisien.


