




Tim kami memiliki lebih dari 7.000.000 trader!
Setiap harinya kami bekerja sama untuk meningkatkan trading. Kami memperoleh hasil tinggi dan terus bergerak maju.
Pengakuan dari jutaan trader diseluruh dunia merupakan apresiasi terbaik dari kerja kami! Anda membuat pilihan anda dan kami akan melakukan semua yang dibutuhkan untuk memenuhi ekspektasi anda!
We are a great team together!
InstaSpot. Bangga bekerja bersama anda!





Seorang Aktor, juara 6 turnamen UFC dan pahlawan sesungguhnya!
Pria yang berhasil. Pria yang berusaha keras.
Rahasia dibalik kesuksesan Taktarov adalah pergerakan konstan menuju target.
Tunjukkan seluruh sisi dari bakat anda!
Temukan, coba, gagal - namun jangan pernah berhenti!
InstaSpot. Cerita sukses anda dimulai disini!

Kemarin, indeks saham mencatat kenaikan yang kuat. S&P 500 naik sebesar 1,48%, dan Nasdaq 100 bertambah 0,01%. Dow Jones Industrial Average menguat 1,32%.
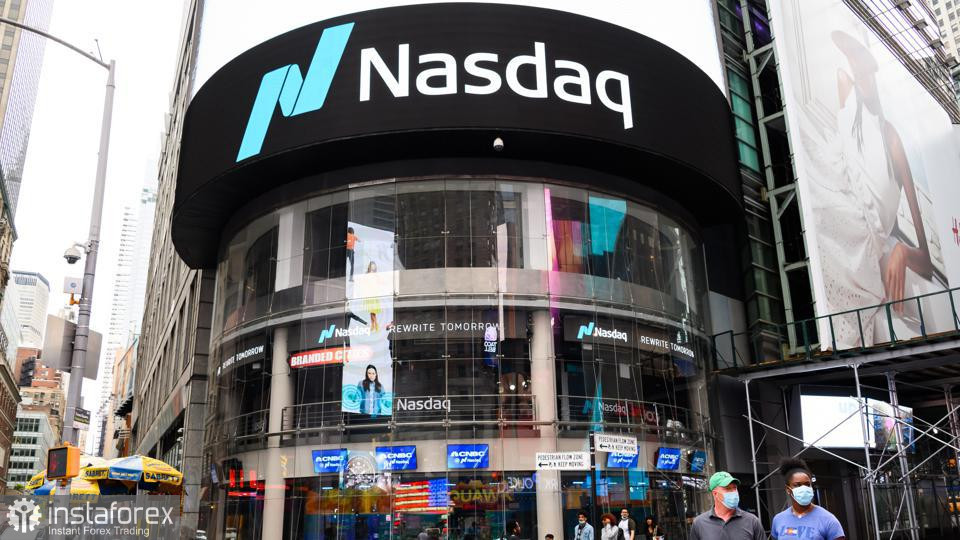
Indeks global berada dekat rekor tertinggi, dan kontrak berjangka mengindikasikan potensi berlanjutnya kenaikan setelah rally Wall Street yang dipimpin sektor teknologi menyusul peningkatan volatilitas selama sebulan. Indeks MSCI All-Country World berada di kisaran 1.130, tepat di bawah rekor 1.136,59. Rally saham teknologi pada hari Senin mendorong S&P 500 mendekati level tertinggi sepanjang masanya. Saham Palantir Technologies melonjak 14% dalam perdagangan setelah jam bursa setelah perusahaan tersebut menaikkan panduan kinerjanya.
Imbal hasil obligasi pemerintah AS menghapus sebagian kenaikan hari Senin seiring rebound harga minyak setelah penurunan pada sesi sebelumnya, yang dipicu oleh optimisme terkait de-eskalasi di Timur Tengah. Imbal hasil obligasi pemerintah AS tenor 10 tahun naik dua basis poin menjadi 4,69%, sementara WTI menguat 0,8% ke $81/bbl setelah terkoreksi 5% pada hari Senin.
Yen melemah 0,3% ke 157,70 per dolar pada sesi Asia, melepaskan sebagian penguatan yang didorong intervensi pada awal minggu ini — mata uang tersebut sebelumnya sempat menguat lebih dari 4% dalam empat sesi terakhir menyusul aksi terkoordinasi pasar valas AS–Jepang.
Data yang dirilis menunjukkan aktivitas manufaktur AS pada Juli meningkat dengan laju tercepat dalam lebih dari empat tahun, produksi industri naik tipis, dan perusahaan kembali melakukan perekrutan. Namun, perkembangan geopolitik dan data ketenagakerjaan AS yang akan dirilis akhir minggu ini masih akan menjadi fokus utama, ketika para pelaku pasar menilai apakah penurunan harga minyak dapat meredakan tekanan inflasi dan mengubah dinamika ekspektasi suku bunga. Ujian pasar lainnya berpotensi muncul pada hari Selasa ketika SpaceX melaporkan kinerja untuk pertama kalinya sebagai perusahaan publik — sebuah peristiwa yang membuka jalan bagi salah satu periode pembukaan lock-up saham terbesar dalam sejarah pasar modal, dengan potensi hingga $116 miliar saham tersedia untuk dijual mulai bulan depan.
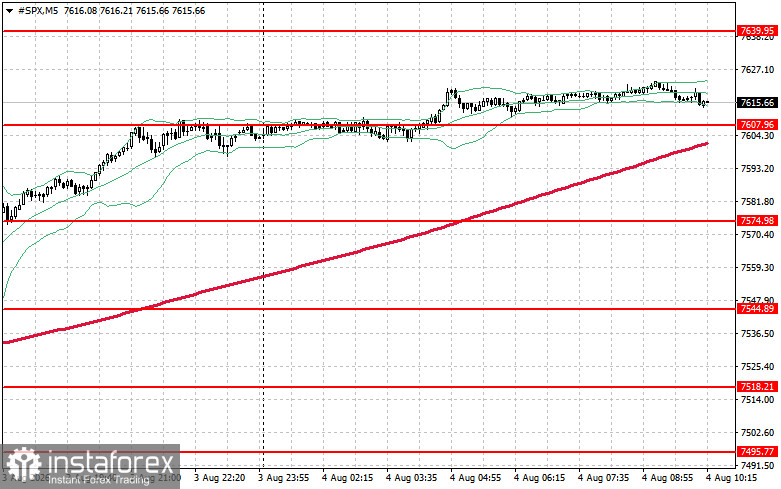
Secara teknikal, grafik harian S&P 500 menunjukkan bahwa tugas langsung bagi para pembeli adalah menembus level resistance terdekat di $7.633. Jika itu tercapai, potensi berlanjutnya lanjutan akan terkonfirmasi dan membuka jalan menuju $7.656. Mempertahankan kendali di atas $7.679 akan semakin mengukuhkan posisi kubu bull. Di sisi bawah, pembeli perlu mempertahankan area $7.607. Breakout ke bawah level tersebut berpeluang mendorong indeks ini kembali ke $7.574 dan membuka jalan menuju $7.544.
*Analisis pasar yang diposting disini dimaksudkan untuk meningkatkan pengetahuan Anda namun tidak untuk memberi instruksi trading.
Tinjauan analitis InstaSpot akan membuat Anda menyadari sepenuhnya tren pasar! Sebagai klien InstaSpot, Anda dilengkapi dengan sejumlah besar layanan gratis untuk trading yang efisien.


