


Legenda tim InstaSpot!
Legenda! Anda pikir legenda adalah retorika yang bombastis? Lalu, bagaimana menyebut seorang pria, seorang Asia pertama yang memenangkan kejuaraan catur dunia junior pada usia 18 tahun, dan yang menjadi Grandmaster India pertama pada usia 19 tahun? Itulah awal perjalanan yang sulit dalam meraih gelar Juara Dunia bagi Viswanathan Anand, pria yang menjadi bagian dari sejarah catur untuk selamanya. Sekarang, satu lagi legenda masuk ke dalam tim InstaSpot!


Borussia merupakan salah satu klub sepakbola paling terkenal di Jerman, yang telah berulang kali membuktikan pada para penggemarnya: semangat kompetisi dan kepemimpinan pasti akan mengarah pada kesuksesan. Lakukan trading dengan cara yang sama seperti para profesional olahraga: percaya diri dan aktif. Gunakan "kunci" dari Borussia FC dan jadilah yang terdepan bersama InstaSpot!

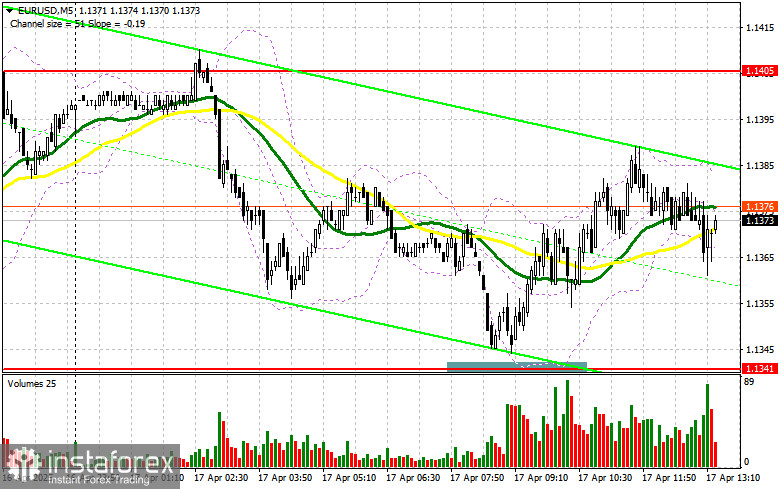
In my morning forecast, I highlighted the 1.1341 level and planned to base my market entry decisions on it. Let's look at the 5-minute chart and analyze what happened. A decline occurred, but just like the previous day, a false breakout near 1.1341 never materialized, as the pair fell just a few points short of testing that level. As a result, I did not enter any trades. The technical outlook for the second half of the day remains unchanged.
To open long positions on EUR/USD:
In addition to the European Central Bank's decision—discussed in detail in my morning forecast—this afternoon brings U.S. data on initial jobless claims and building permits. The speech by FOMC member Michael S. Barr will also be on traders' radar, though it's unlikely he'll say anything new that Powell didn't cover yesterday.
In the event of a decline and strong U.S. data, only a false breakout near the 1.1341 support level will serve as a signal to buy EUR/USD, aiming for a continuation of the bullish trend with a target of retesting 1.1405—a level that remained out of reach in the first half of the day. A breakout and retest of this range would confirm a valid entry point for a move toward the 1.1467 area, the yearly high. The most distant target will be 1.1526, where I plan to take profit.
If EUR/USD falls and there is no buying activity around 1.1341, pressure on the euro will increase, possibly triggering a deeper correction—especially after the ECB meeting. In this case, bears could push the pair down to 1.1267. Only after a false breakout there will I consider buying the euro. I plan to open long positions immediately from 1.1167 on a rebound, aiming for an intraday upward correction of 30–35 points.
To open short positions on EUR/USD:
If U.S. data disappoints and the ECB does not issue a strong dovish signal regarding future rate cuts, the euro will likely continue to rise. In that case, only a false breakout near 1.1405 would be sufficient to enter short positions with a target of returning to 1.1341, where the moving averages are currently acting as support for the bulls. A breakout and consolidation below this range will offer a selling opportunity toward 1.1267. The most distant target will be the 1.1206 area, where I plan to take profit.
If EUR/USD rises in the second half of the day and bears show no activity around 1.1405, buyers may push the pair back to last week's highs. In this scenario, I will delay short positions until a test of the next resistance level at 1.1467, where I will sell only after a failed consolidation. I plan to sell on a rebound from 1.1526 in case of no downward movement there, aiming for a 30–35 point correction.
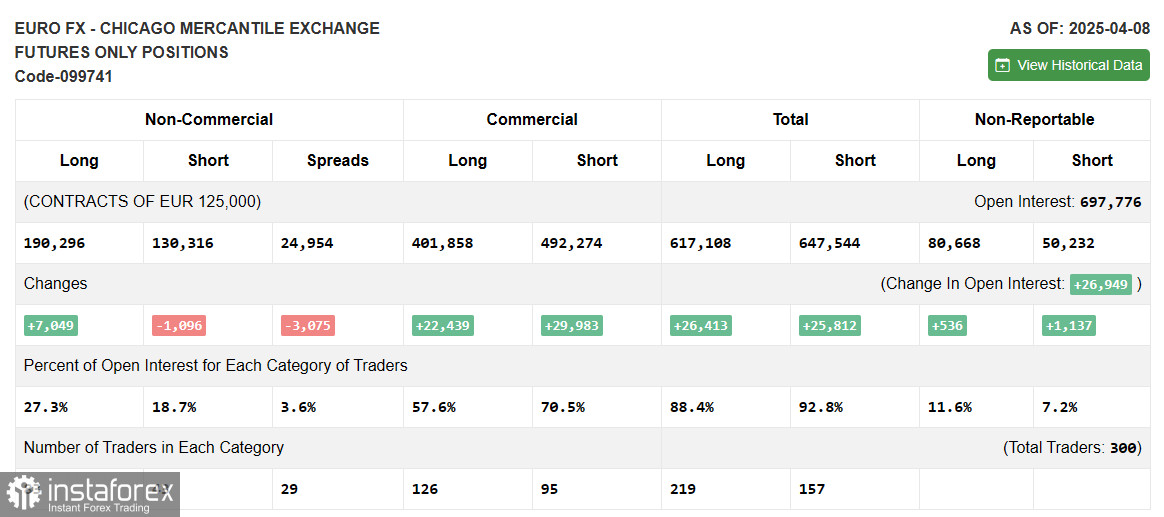
COT Report (Commitment of Traders) – April 8:
The report showed an increase in long positions and a decrease in short ones. Following Trump's announcement of a 90-day tariff freeze, the euro resumed growth, as evidenced by the rise in long positions. Additionally, fundamental data showing declining inflation in the eurozone boosted demand for the euro, as expectations of stronger ECB stimulus grew.
According to the COT report, long non-commercial positions rose by 7,049 to 190,296 and short non-commercial positions fell by 1,096 to 130,316. As a result, the net position increased by 2,466.
Indicator Signals:
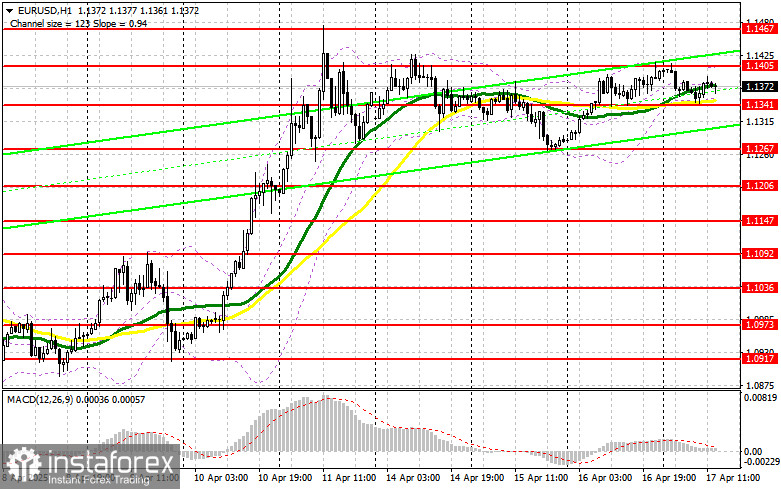
Moving Averages: Trading is occurring near the 30- and 50-day moving averages, indicating a sideways market.
Note: The author refers to H1 (hourly) chart averages, which differ from classical D1 (daily) moving averages.
Bollinger Bands: In case of a decline, the lower band around 1.1341 will act as support.
Indicator Descriptions:
*Analisis pasar yang diposting disini dimaksudkan untuk meningkatkan pengetahuan Anda namun tidak untuk memberi instruksi trading.
Tinjauan analitis InstaSpot akan membuat Anda menyadari sepenuhnya tren pasar! Sebagai klien InstaSpot, Anda dilengkapi dengan sejumlah besar layanan gratis untuk trading yang efisien.


