


Legenda tim InstaSpot!
Legenda! Anda pikir legenda adalah retorika yang bombastis? Lalu, bagaimana menyebut seorang pria, seorang Asia pertama yang memenangkan kejuaraan catur dunia junior pada usia 18 tahun, dan yang menjadi Grandmaster India pertama pada usia 19 tahun? Itulah awal perjalanan yang sulit dalam meraih gelar Juara Dunia bagi Viswanathan Anand, pria yang menjadi bagian dari sejarah catur untuk selamanya. Sekarang, satu lagi legenda masuk ke dalam tim InstaSpot!


Borussia merupakan salah satu klub sepakbola paling terkenal di Jerman, yang telah berulang kali membuktikan pada para penggemarnya: semangat kompetisi dan kepemimpinan pasti akan mengarah pada kesuksesan. Lakukan trading dengan cara yang sama seperti para profesional olahraga: percaya diri dan aktif. Gunakan "kunci" dari Borussia FC dan jadilah yang terdepan bersama InstaSpot!

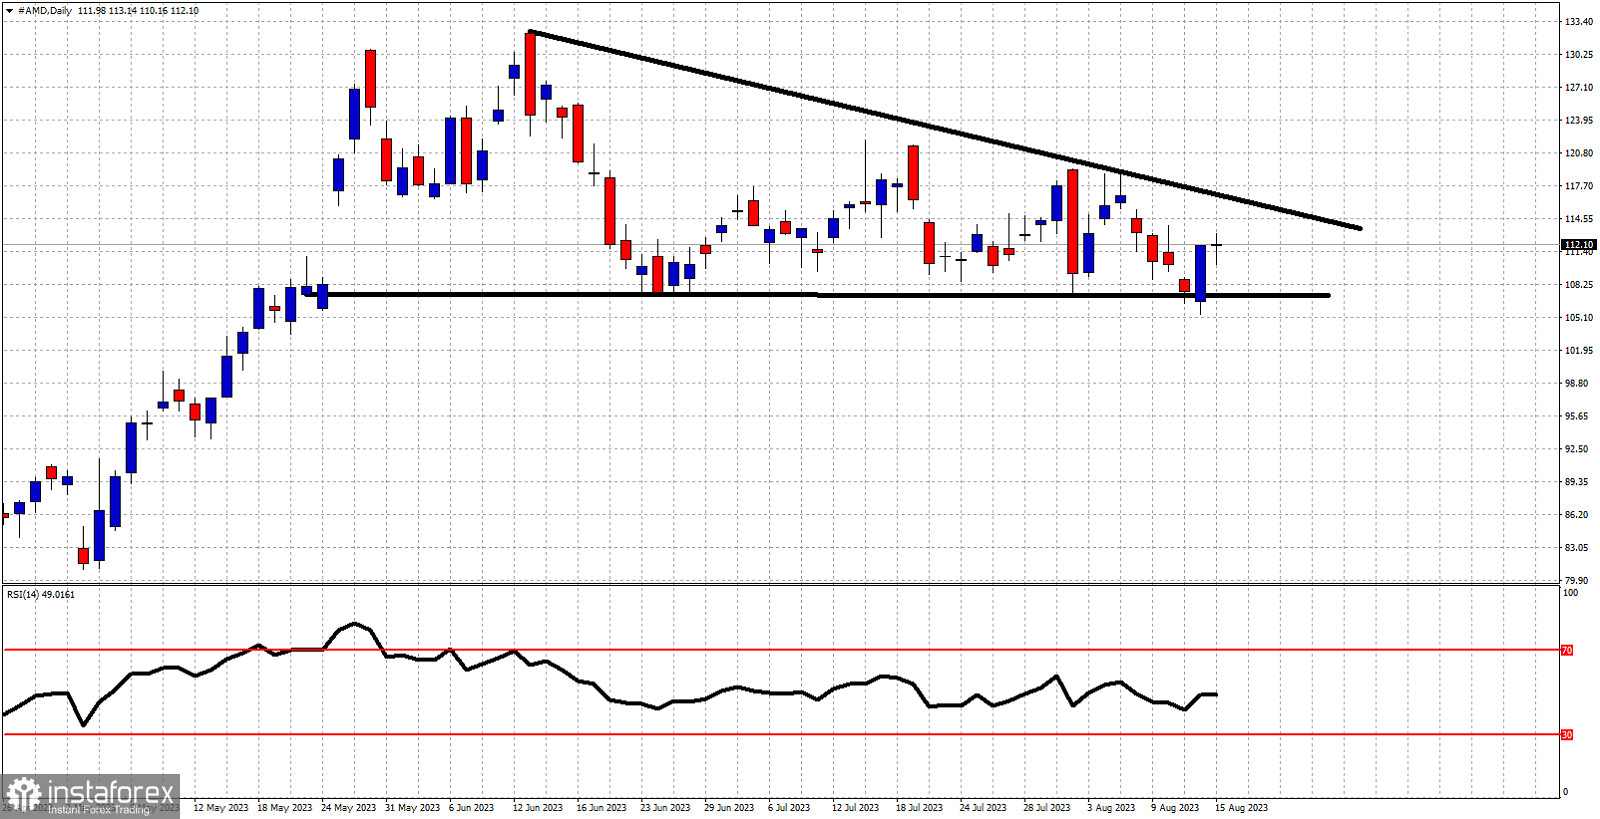
Black lines- descending triangle pattern
AMD stock price continues to trade sideways inside the descending triangle pattern. Price recently got rejected at the upper triangle boundary and as expected moved lower towards the lower boundary of the pattern around $107. Support at $107 has been respected and price is now bouncing off this support level. Resistance is found at $116.35. Support remains key at $107. There is still room for price to continue to trade inside the triangle pattern. Traders need to remain patient.
*Analisis pasar yang diposting disini dimaksudkan untuk meningkatkan pengetahuan Anda namun tidak untuk memberi instruksi trading.
Tinjauan analitis InstaSpot akan membuat Anda menyadari sepenuhnya tren pasar! Sebagai klien InstaSpot, Anda dilengkapi dengan sejumlah besar layanan gratis untuk trading yang efisien.


