


Legenda tim InstaSpot!
Legenda! Anda pikir legenda adalah retorika yang bombastis? Lalu, bagaimana menyebut seorang pria, seorang Asia pertama yang memenangkan kejuaraan catur dunia junior pada usia 18 tahun, dan yang menjadi Grandmaster India pertama pada usia 19 tahun? Itulah awal perjalanan yang sulit dalam meraih gelar Juara Dunia bagi Viswanathan Anand, pria yang menjadi bagian dari sejarah catur untuk selamanya. Sekarang, satu lagi legenda masuk ke dalam tim InstaSpot!


Borussia merupakan salah satu klub sepakbola paling terkenal di Jerman, yang telah berulang kali membuktikan pada para penggemarnya: semangat kompetisi dan kepemimpinan pasti akan mengarah pada kesuksesan. Lakukan trading dengan cara yang sama seperti para profesional olahraga: percaya diri dan aktif. Gunakan "kunci" dari Borussia FC dan jadilah yang terdepan bersama InstaSpot!

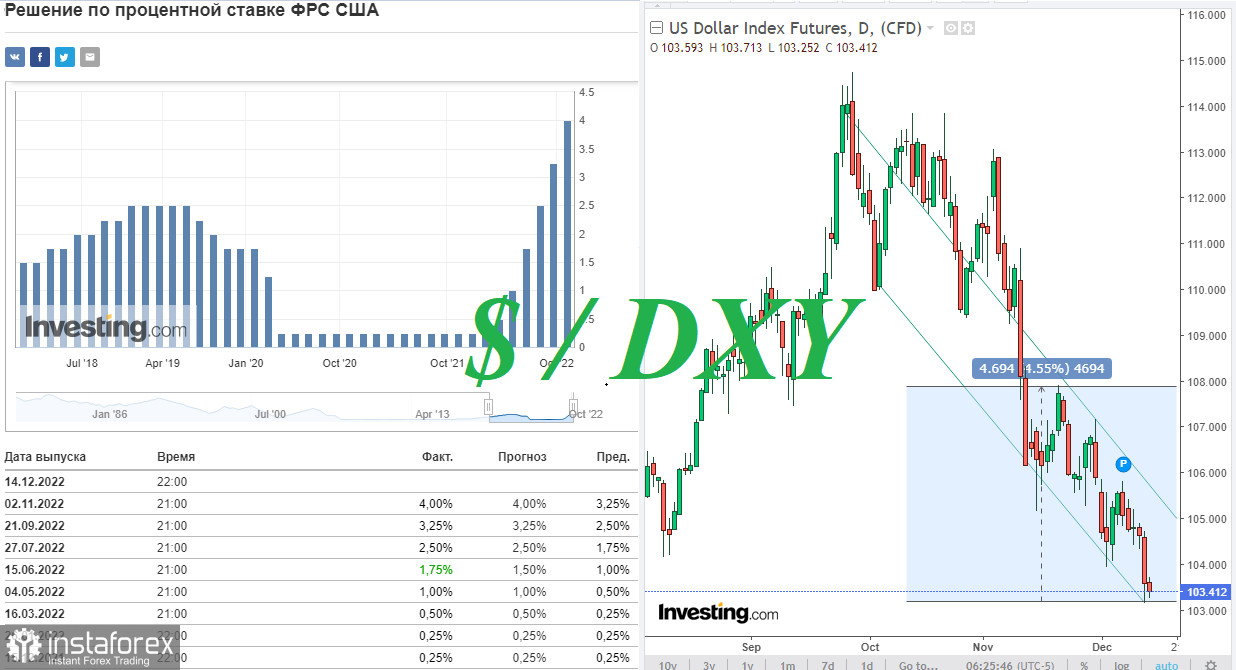
Yesterday's release of fresh U.S. inflation figures, which indicated another slowdown in inflation, brought the dollar down. The dollar index (DXY) fell yesterday to 103.15, losing more than 1% at the moment. Though the DXY was able to recoup some of its intraday losses by the end of yesterday's trading day, the dollar and dollar index remain under pressure today, with DXY futures currently trading near 103.41, 26 points above yesterday's local (since July) low.
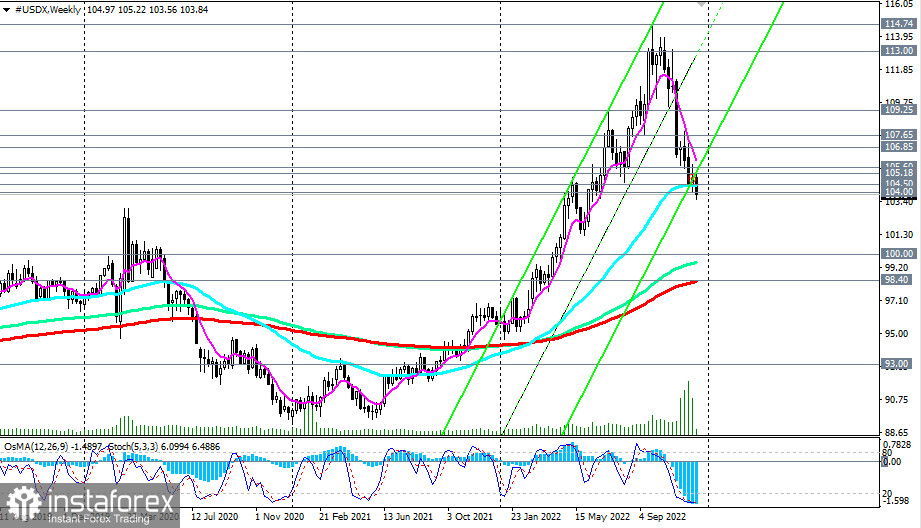
Many economists are already predicting the Fed will cut the size of the rate hike again in early 2023, moving to 0.25% hikes in February and March. And this is a harbinger of a deeper drop in DXY. The first signal for new short positions will be a breakdown of the local support level and 50 EMA on the weekly chart of the DXY index (CFD #USDX in the MT4 trading terminal), passing through the mark of 104.50, and the confirmation will be a breakdown of the "round" support level 104.00.
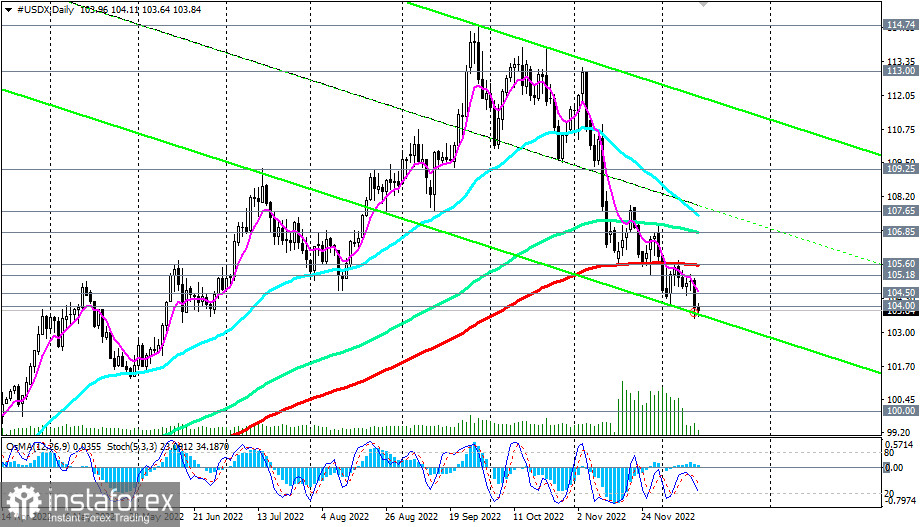
As you can see, both support levels were broken yesterday, and as of writing, DXY is trading near 103.84, deepening into the medium-term bear market zone (below the 105.60 key resistance level - 200 EMA on the daily CFD #USDX chart).
The targets for further decline are the "round" and psychologically significant support level 100.00 and the level of 98.40 (200 EMA on the weekly chart), the breakdown of which will finally break the DXY bullish trend.
Alternatively, the DXY will resume growth, returning to the bull market zone (above the 105.60 resistance level).
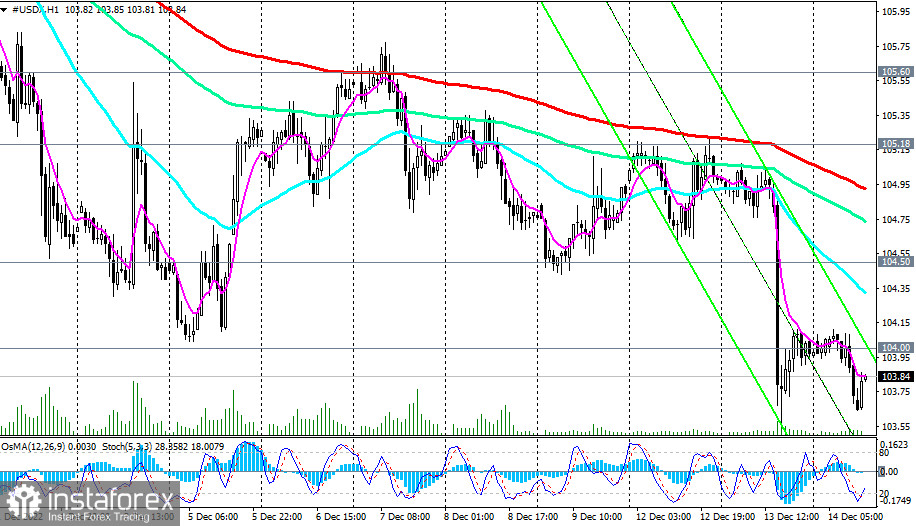
The first signals for the implementation of this scenario will be the breakdown of the resistance levels 104.50, 104.90 (200 EMA on the 1-hour chart).
In the meantime, short positions remain preferable even below the 104.50 resistance level.
Support levels: 103.00, 102.00, 101.00, 100.00, 99.00, 98.40
Resistance levels: 104.00, 104.50, 104.90, 105.18, 105.60, 106.85, 107.65
Trading Tips
Sell Stop 103.50. Stop Loss 104.20. Take-Profit 103.00, 102.00, 101.00, 100.00, 99.00, 98.40
Buy Stop 104.20. Stop-Loss 103.50. Take-Profit 104.50, 104.90, 105.18, 105.60, 106.85, 107.65, 108.00, 109.00, 109.25, 110.00, 111.00, 113.00
*Analisis pasar yang diposting disini dimaksudkan untuk meningkatkan pengetahuan Anda namun tidak untuk memberi instruksi trading.
Tinjauan analitis InstaSpot akan membuat Anda menyadari sepenuhnya tren pasar! Sebagai klien InstaSpot, Anda dilengkapi dengan sejumlah besar layanan gratis untuk trading yang efisien.


