


Legenda tim InstaSpot!
Legenda! Anda pikir legenda adalah retorika yang bombastis? Lalu, bagaimana menyebut seorang pria, seorang Asia pertama yang memenangkan kejuaraan catur dunia junior pada usia 18 tahun, dan yang menjadi Grandmaster India pertama pada usia 19 tahun? Itulah awal perjalanan yang sulit dalam meraih gelar Juara Dunia bagi Viswanathan Anand, pria yang menjadi bagian dari sejarah catur untuk selamanya. Sekarang, satu lagi legenda masuk ke dalam tim InstaSpot!


Borussia merupakan salah satu klub sepakbola paling terkenal di Jerman, yang telah berulang kali membuktikan pada para penggemarnya: semangat kompetisi dan kepemimpinan pasti akan mengarah pada kesuksesan. Lakukan trading dengan cara yang sama seperti para profesional olahraga: percaya diri dan aktif. Gunakan "kunci" dari Borussia FC dan jadilah yang terdepan bersama InstaSpot!

Overview :
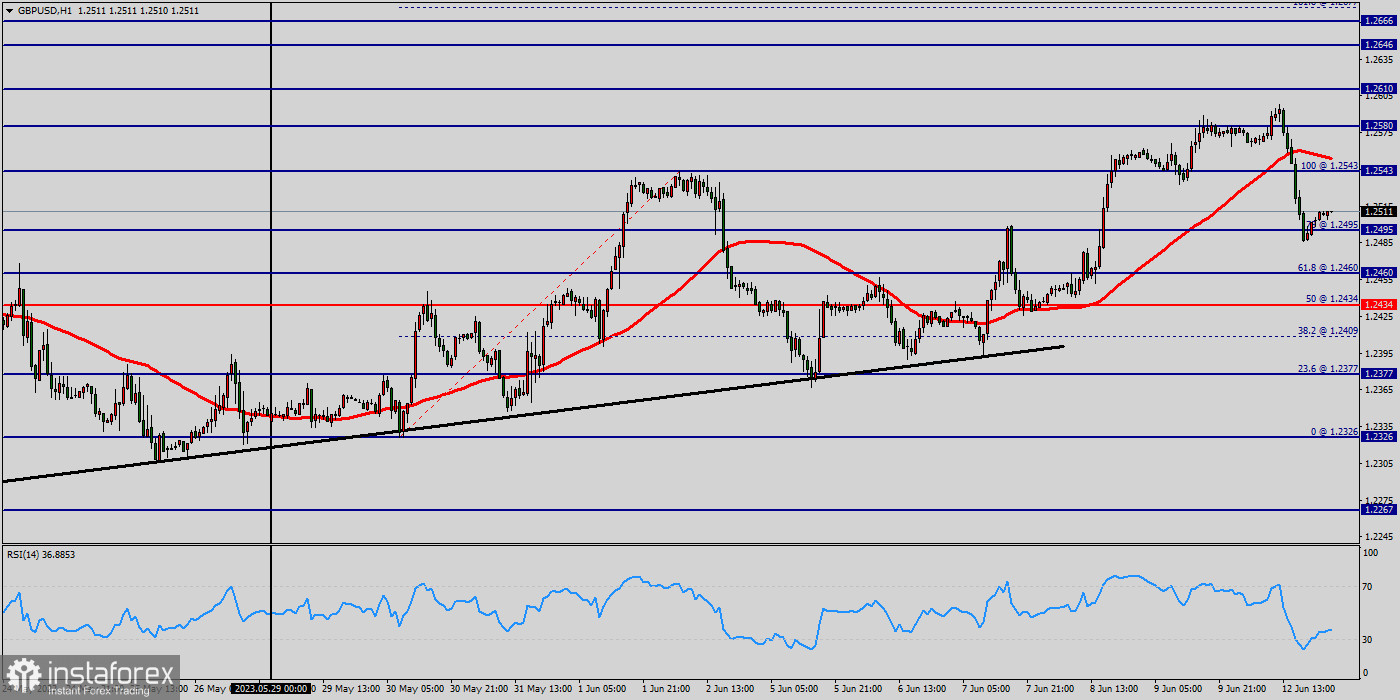
The GBP/USD pair will continue rising from the level of 1.2377 today. So, the support is found at the level of 1.2377, which represents the 23.6% Fibonacci retracement level in the H1 time frame. Since the trend is above the 23.6% Fibonacci level, the market is still in an uptrend. Therefore, the GBP/USD pair is continuing with a bullish trend from the new support of 1.2377.
The current price is set at the level of 1.2423 that acts as a daily pivot point seen at 1.2434. Equally important, the price is in a bullish channel. According to the previous events, we expect the GBP/USD pair to move between 1.2495 and 1.2377. This would suggest a bullish market because the RSI indicator is still in a positive area and does not show any trend-reversal signs.
Therefore, strong support will be formed at the level of 1.2377 providing a clear signal to buy with the target seen at 1.2460. If the trend breaks the resistance at 1.2460 (first resistance), the pair will move upwards continuing the development of the bullish trend to the level 1.2495 in order to test the daily resistance 2.
In the same time frame, resistance is seen at the levels of 1.2495 and 1.2500. The stop loss should always be taken into account for that it will be reasonable to set your stop loss at the level of 1.2326 (below the support 2).
The GBP/USD pair broke resistance which turned to strong support at the level of 1.2377 yesterday. The level of 1.2377 coincides with a golden ratio (23.6% of Fibonacci), which is expected to act as major support today.
The Relative Strength Index (RSI) is considered overbought because it is above 55. The RSI is still signaling that the trend is upward as it is still strong above the moving average (100).
This suggests the pair will probably go up in coming hours. Accordingly, the market is likely to show signs of a bullish trend. In other words, buy orders are recommended above 1.2377 with the first target at the level of 1.2434. From this point, the pair is likely to begin an ascending movement to the point of 1.0212 and further to the level of 1.2434.
Consequently, the first support is set at the level of 1.2377. So, the market is likely to show signs of a bullish trend around the spot of 1.2377/1.2380. If the GBP/USD pair succeed to break through the resistance level of 1.2434, the market will scaling further to 1.2460. This would suggest a bullish market because the RSI indicator is still in a positive area and does not show any trend-reversal signs.
The pair is expected to drop higher towards at least 1.2460 with a view to test the daily pivot point. The level of 1.2543 will act as strong resistance and the double top is already set at the point of 1.2543. On the other hand, if a breakout happens at the support level of 1.2377, then this scenario may become invalidated.
*Analisis pasar yang diposting disini dimaksudkan untuk meningkatkan pengetahuan Anda namun tidak untuk memberi instruksi trading.
Tinjauan analitis InstaSpot akan membuat Anda menyadari sepenuhnya tren pasar! Sebagai klien InstaSpot, Anda dilengkapi dengan sejumlah besar layanan gratis untuk trading yang efisien.


