


Legenda tim InstaSpot!
Legenda! Anda pikir legenda adalah retorika yang bombastis? Lalu, bagaimana menyebut seorang pria, seorang Asia pertama yang memenangkan kejuaraan catur dunia junior pada usia 18 tahun, dan yang menjadi Grandmaster India pertama pada usia 19 tahun? Itulah awal perjalanan yang sulit dalam meraih gelar Juara Dunia bagi Viswanathan Anand, pria yang menjadi bagian dari sejarah catur untuk selamanya. Sekarang, satu lagi legenda masuk ke dalam tim InstaSpot!


Borussia merupakan salah satu klub sepakbola paling terkenal di Jerman, yang telah berulang kali membuktikan pada para penggemarnya: semangat kompetisi dan kepemimpinan pasti akan mengarah pada kesuksesan. Lakukan trading dengan cara yang sama seperti para profesional olahraga: percaya diri dan aktif. Gunakan "kunci" dari Borussia FC dan jadilah yang terdepan bersama InstaSpot!

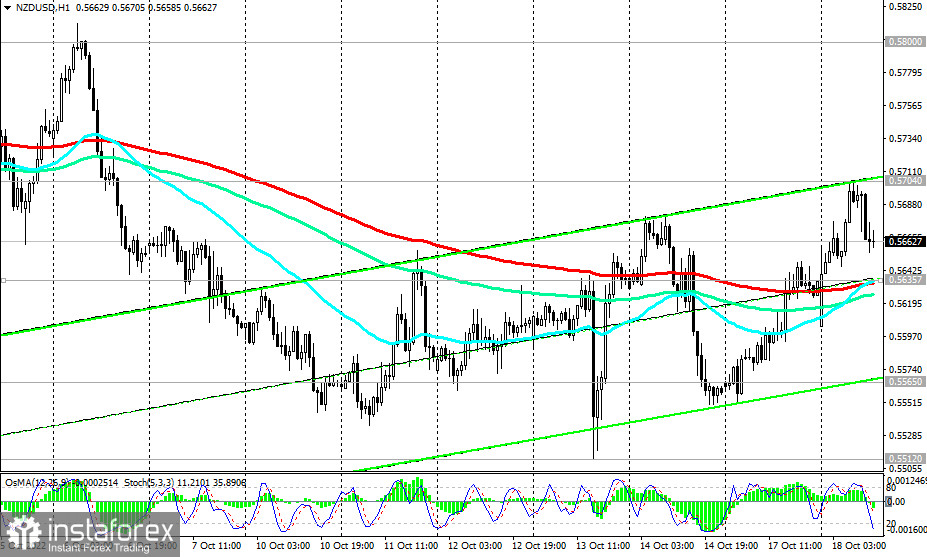
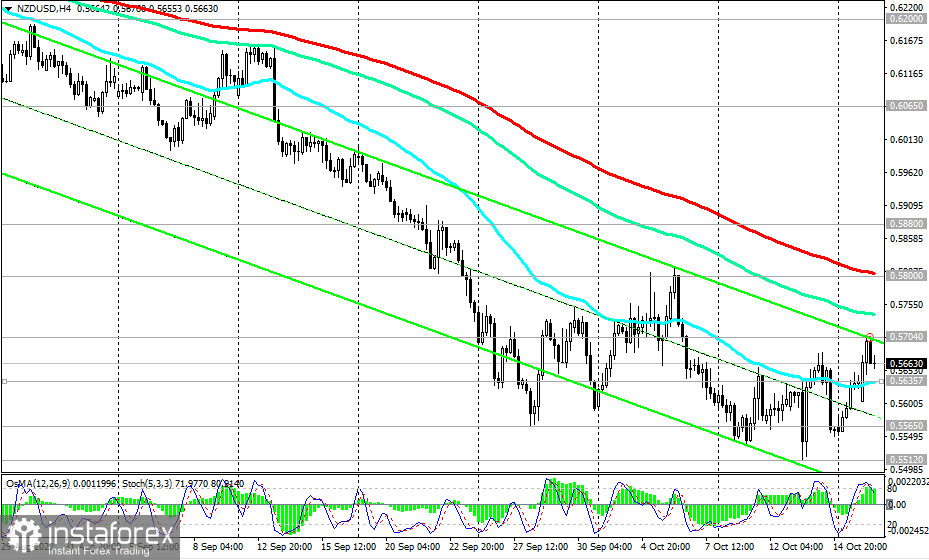
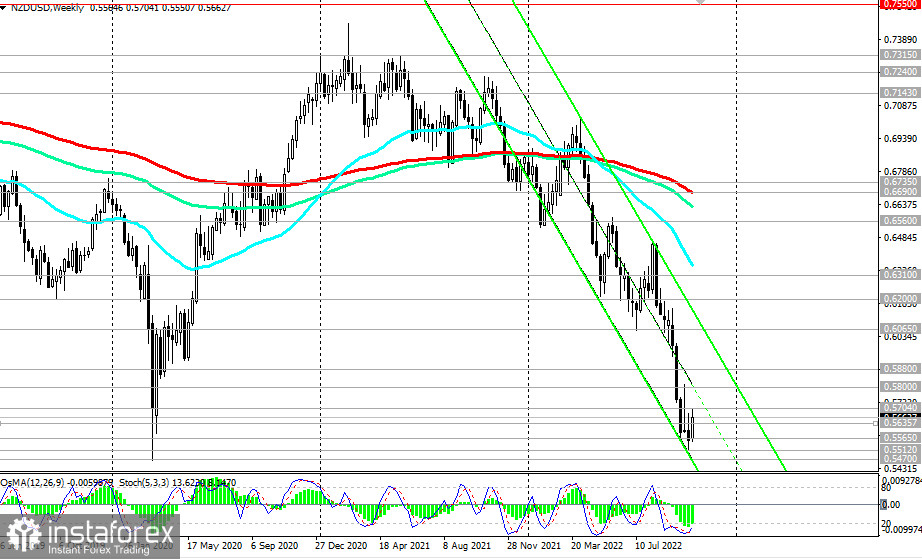
Today, NZD/USD half retains the bullish momentum gained from the inflation data in New Zealand that exceeded the forecast, while also trying to stay in the zone above the short-term important support level of 0.5635 (200 EMA on the 1-hour chart). As of writing, the pair is trading near the 0.5662 mark. It is characteristic that the OsMA and Stochastic technical indicators paint a contradictory picture: on the daily and weekly charts they turn to long positions, and on the 1-hour and 4-hour charts they turn to short positions, signaling the end of the upward correction.
The signal for the resumption of sales will be a breakdown of the support level of 0.5635. In this case, NZD/USD will head deeper into the descending channel on the weekly chart and towards 0.5470.
In an alternative scenario, the upward correction will continue to the resistance levels of 0.5800 (200 EMA on the 4-hour chart), 0.5880 (50 EMA on the daily chart).
In general, the downward dynamics of NZD/USD prevails, while the pair remains in the zone of a long-term bear market—below the key resistance levels of 0.6690 (200 EMA on the weekly chart), 0.6310 (200 EMA on the daily chart). Only their breakdown will bring the pair back into the zone of a long-term bull market.
And today, the volatility in the NZD/USD pair may increase again (in the period after 13:15 - 14:00 GMT), which will be associated with the publication of macro statistics for the US and New Zealand, as well as at 21:30 during the speech of Fed representative Neel Kashkari.
Support levels: 0.5635, 0.5600, 0.5565, 0.5512, 0.5470
Resistance levels: 0.5704, 0.5800, 0.5880, 0.6065, 0.6200, 0.6310, 0.6560, 0.6690, 0.6735
Trading Tips
Sell Stop 0.5620. Stop-Loss 0.5710. Take-Profit 0.5600, 0.5565, 0.5512, 0.5470
Buy Stop 0.5710. Stop-Loss 0.56250. Take-Profit 0.5800, 0.5880, 0.6065, 0.6200, 0.6310, 0.6560, 0.6690, 0.6735
*Analisis pasar yang diposting disini dimaksudkan untuk meningkatkan pengetahuan Anda namun tidak untuk memberi instruksi trading.
Tinjauan analitis InstaSpot akan membuat Anda menyadari sepenuhnya tren pasar! Sebagai klien InstaSpot, Anda dilengkapi dengan sejumlah besar layanan gratis untuk trading yang efisien.


