


Tim kami memiliki lebih dari 7.000.000 trader!
Setiap harinya kami bekerja sama untuk meningkatkan trading. Kami memperoleh hasil tinggi dan terus bergerak maju.
Pengakuan dari jutaan trader diseluruh dunia merupakan apresiasi terbaik dari kerja kami! Anda membuat pilihan anda dan kami akan melakukan semua yang dibutuhkan untuk memenuhi ekspektasi anda!
We are a great team together!
InstaSpot. Bangga bekerja bersama anda!


Seorang Aktor, juara 6 turnamen UFC dan pahlawan sesungguhnya!
Pria yang berhasil. Pria yang berusaha keras.
Rahasia dibalik kesuksesan Taktarov adalah pergerakan konstan menuju target.
Tunjukkan seluruh sisi dari bakat anda!
Temukan, coba, gagal - namun jangan pernah berhenti!
InstaSpot. Cerita sukses anda dimulai disini!

Ethereum
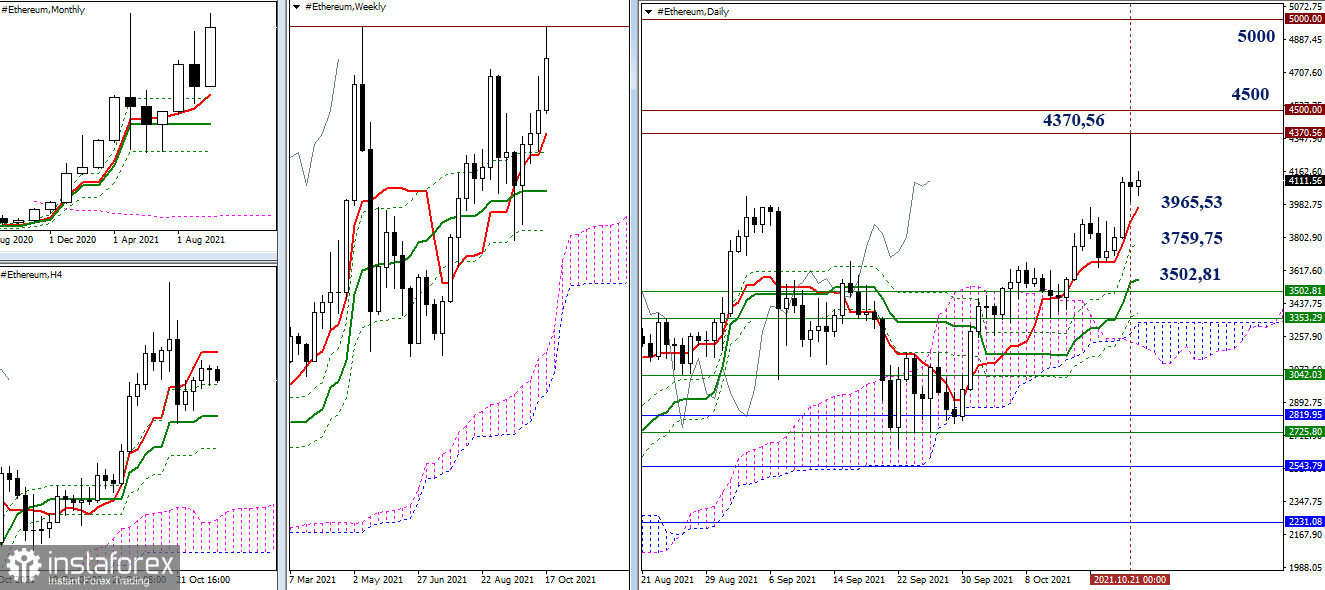
This week, the influence zone of the maximum extremum (4370.56) has been tested. During testing, a rebound was indicated. The week will be closed today, and the weekly result is interesting. The formation of a rebound can inspire the bears for new successes. The nearest supports are currently located at the daily levels of 3965.53 (Tenkan) and 3759.75 (Fibo Kijun). Further, the bears will search for a wide support zone that unites the levels of different timeframes. However, if the bulls manage to keep their reached positions, then the breakdown of 4370.56 will allow us to test 4500.00. Here, the psychological level of 5000.00 will be the next important level of the bulls.
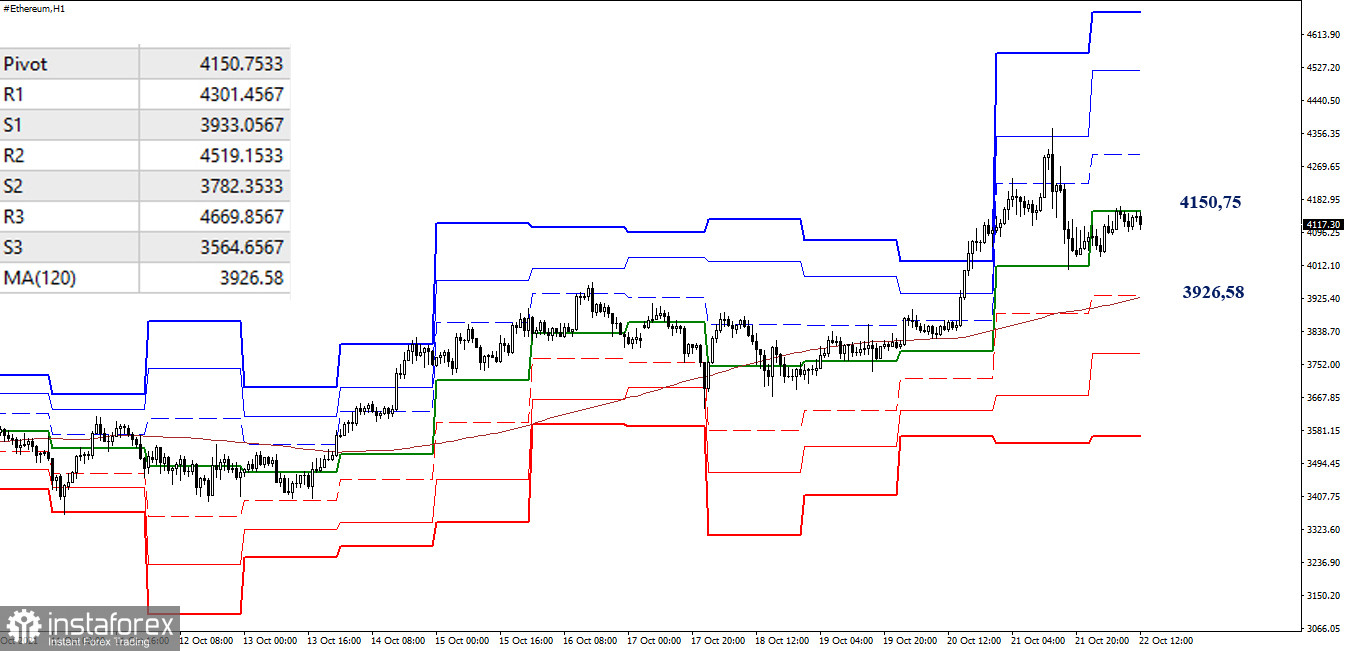
The downward correction led to the fact that the central pivot level (4150.75) in the smaller timeframes went to the bearish side. The next most important line for the bears is now 3926.58 (weekly long-term trend). A consolidation below and reversal of moving averages will change the current balance of power in these timeframes. The weekly long-term trend is located below, where the support for the classic pivot levels 3782.35 (S2) - 3564.66 (S3) are.
But if the central pivot level (4151.75) returns to the bullish side, the interests of the bulls will be directed to updating the maximum extreme (4370.56) and reliably fixing above.
***
Ichimoku Kinko Hyo (9.26.52) and Kijun-sen levels in the higher time frames, as well as classic Pivot Points and Moving Average (120) on the H1 chart, are used in the technical analysis of this cryptocurrency.
*Analisis pasar yang diposting disini dimaksudkan untuk meningkatkan pengetahuan Anda namun tidak untuk memberi instruksi trading.
Tinjauan analitis InstaSpot akan membuat Anda menyadari sepenuhnya tren pasar! Sebagai klien InstaSpot, Anda dilengkapi dengan sejumlah besar layanan gratis untuk trading yang efisien.


