


Náš tým má více než 7 000 000 obchodníků!
Každý den spolupracujeme na zlepšení obchodování. Realizujeme pro vás vysoké zisky a jdeme dále.
Uznání miliony obchodníků po celém světě je nejlepší ocenění naší práce! Vybrali jste si a my uděláme vše, co je potřeba, abychom splnili vaše očekávání!
Jsme spolu skvělý tým!
InstaSpot. Hrdě pracujeme pro vás!


Herec, šampion turnaje UFC 6 a opravdový hrdina!
Muž, který vyhrává. Muž, který jde po cestě
Tajemství úspěchu Taktarova je neustálý pohyb směrem k cíli.
Zjistěte všechny výhody vašeho talentu!
Objevovat, zkoušet i prohrávat - ale nevzdávat se!
InstaSpot. Váš příběh o úspěchu začíná zde!

Bitcoin has been following a slightly upward move that is actually a correction for about two and a half months. This is clearly visible on the daily timeframe. A liquidity pool below remains untouched, and the price is likely to revisit it with roughly 90% probability. Last week, we saw the first signs that the correction might end, but over the weekend, Bitcoin resumed climbing. We are now waiting for the next clear signal that would confirm the end of the 2.5-month correction.
Meanwhile, CryptoQuant analysts reported that April's Bitcoin rally was driven by demand for perpetual futures while spot demand stayed negative. In plain terms, traders in April were opening leveraged long positions, indicating a speculative character to the advance. Long-term spot investors were largely selling the "digital gold." If this is mainly speculation, the market is not positioned for sustained, long-term buying, and even a small drop could trigger liquidations and profit?taking on longs. CryptoQuant also noted that such futures-driven rises typically do not change the underlying trend.
The divergence between spot and futures demand best reflects the fragility of the move. This kind of advance is built on leverage and a thirst for quick gains — it cannot be stable or long-lasting by nature. CryptoQuant also pointed to the lack of a fundamental base for further growth. Once the "futures leg" finishes, markets often move into a correction. In a bear market, the futures leg itself is merely a corrective phase, so the downtrend can resume after it ends. CryptoQuant even said the current market structure strongly resembles 2022: without a shift to positive spot demand, any rise lacks support for continuation.
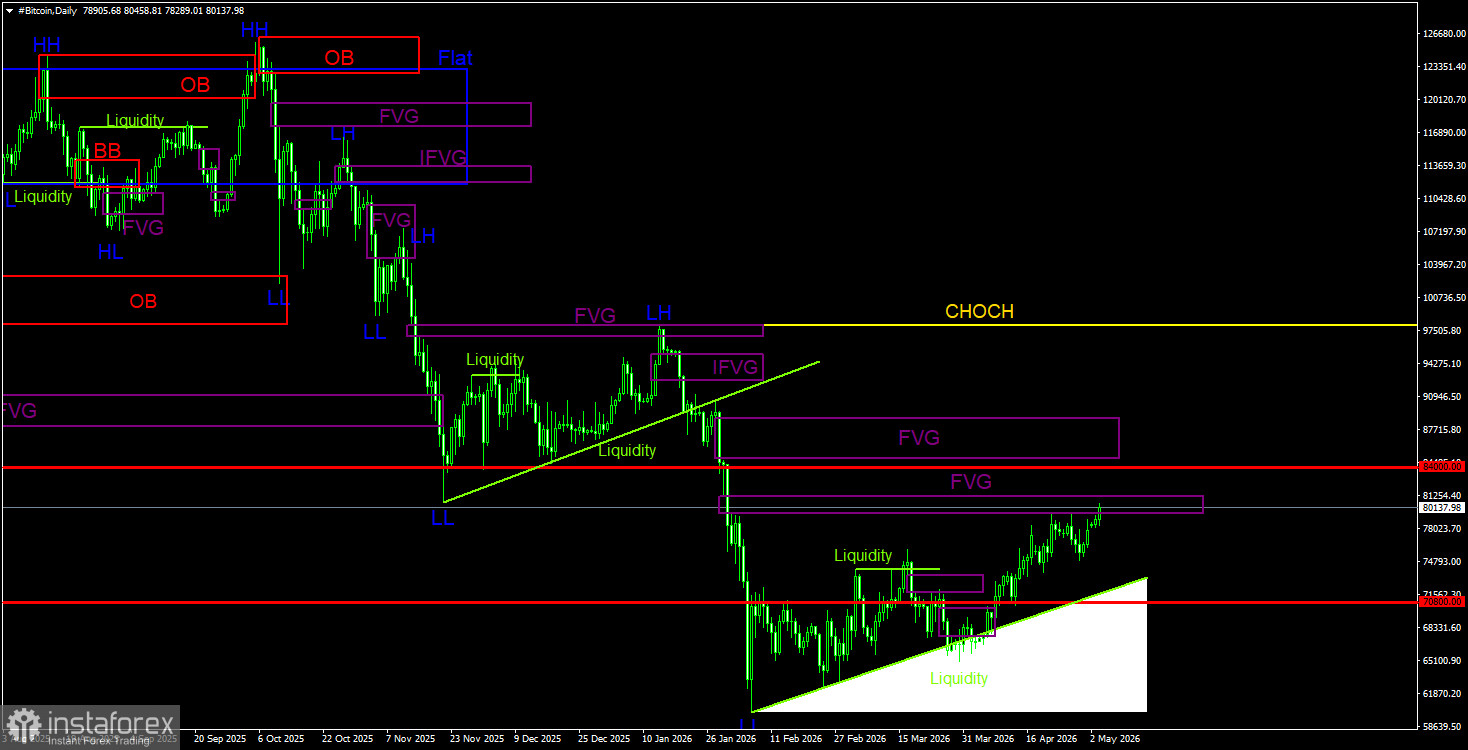
Trading recommendations for BTC/USD
Bitcoin continues to form a full downtrend with corrective rallies against it. We still expect a decline toward $57,500 (the 61.8% Fibonacci retracement of the three?year uptrend), and there are currently no signs of a trend reversal. Even $57,500 does not look like a definitive bottom. The only POI right now is the nearest bearish FVG on the daily TF around $79,300–$81,200. Bitcoin has reacted to this zone for the third time, so we would again expect a response there. However, new reversal evidence will be needed now — structure breaks on lower TFs and formation of new bearish patterns. Downside targets remain below $60,000.
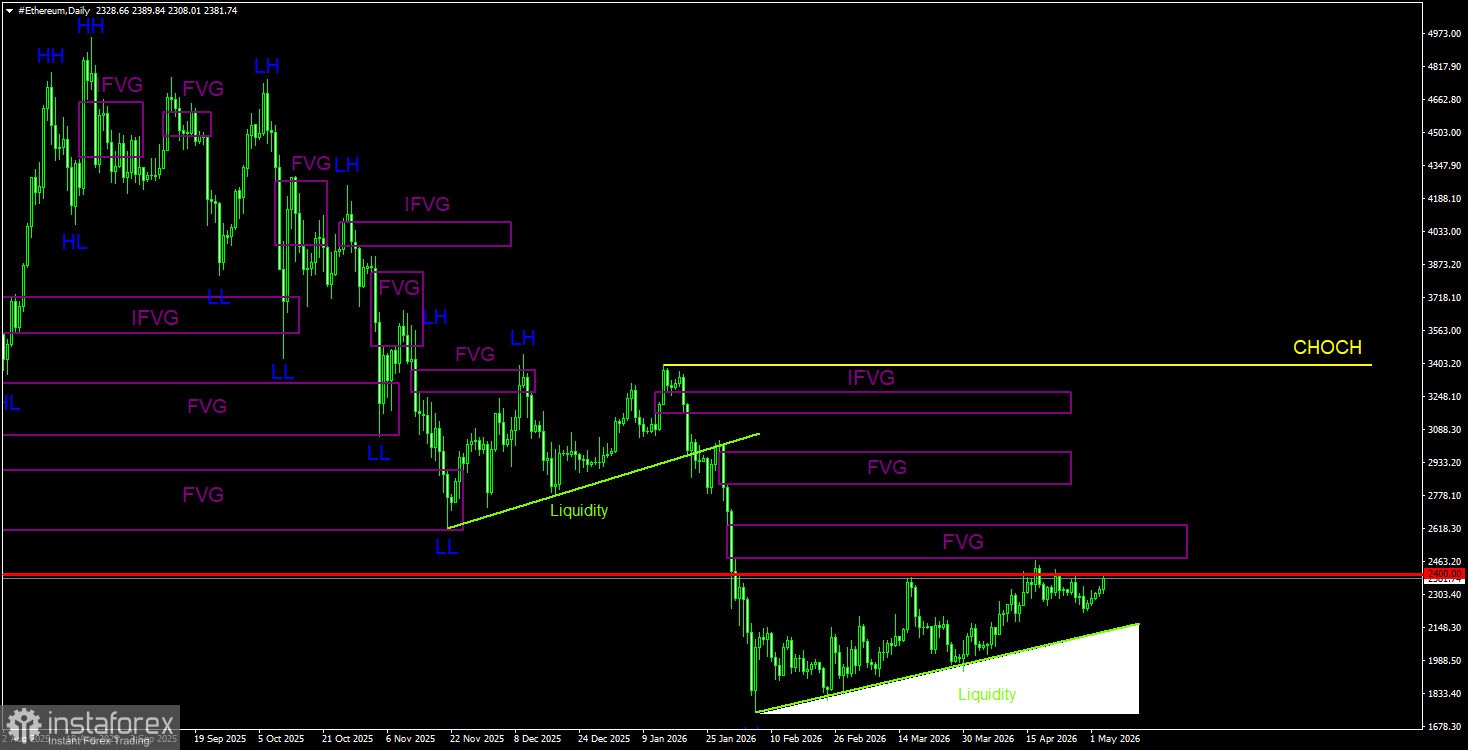
On the daily TF, a downtrend and corrective moves against it are still forming. The key sell setup remains the bearish weekly order block. As we warned, the move triggered by that signal can be strong and prolonged — and we don't believe it's finished. In the near term, ETH may continue a weak upward correction, but all corrections end sooner or later. A sell signal could form on the daily TF at the next FVG, and Bitcoin may produce its own signal on a third attempt. Therefore, watch for structure breaks on lower TFs and the formation (or reaction to) bearish patterns on higher TFs. A target at the 2026 low — $1,744 — looks quite achievable.
Liquidity — liquidity, traders' Stop?Losses that market?makers use to build their positions. FVG — Fair Value Gap (area of price inefficiency). The price often moves quickly through such areas, indicating the absence of one side in the market. Later, the price tends to return and react to these zones. IFVG — Inverted Fair Value Gap. After a return to such a zone, the price does not react but impulsively breaks through and then tests it from the other side.
OB — Order Block. A candle on which a market?maker opened a position in order to harvest liquidity and then form their own position in the opposite direction.
*Účelem zde zveřejněné analýzy trhu je zvýšení vašeho povědomí, nikoli dávání pokynů k obchodování.
Díky analytickým přehledům společnosti InstaSpot získáte plné povědomi o tržních trendech! Jako zákazníkovi společnosti InstaSpot je Vám k dispozici velký počet bezplatných služeb umožňujících efektivní obchodování.


