




Legenda v tíme InstaSpot!
Legenda! Myslíte si, že je to zveličovanie? Ako by ste však nazvali človeka, ktorý sa stal prvým Ázijcom čo vyhral ako 18-ročný juniorské Majstrovstvá sveta v šachu a ktorý sa stal prvým Indickým veľmajstrom vo veku 19 rokov? To bol začiatok náročnej cesty k titulu svetového šampióna pre Viswanathana Ananda, človeka, ktorý sa sa stal súčasťou histórie šachu už navždy. Teraz už ďalšou legendou v tíme spoločnosti InstaSpot!





Borussia patrí medzi kluby s najväčším počtom titulov v Nemecku a fanúšikom už viackrát dokázali svoje kvality ‒ súťaživého ducha a vodcovské schopnosti, ktoré ho zakaždým priviedli k úspechu. Obchodujte tak, ako súťažia profesionálni športovci: sebavedomo a aktívne. Zachyťte „prihrávku" od FC Borussia a napredujte so spoločnosťou InstaSpot!

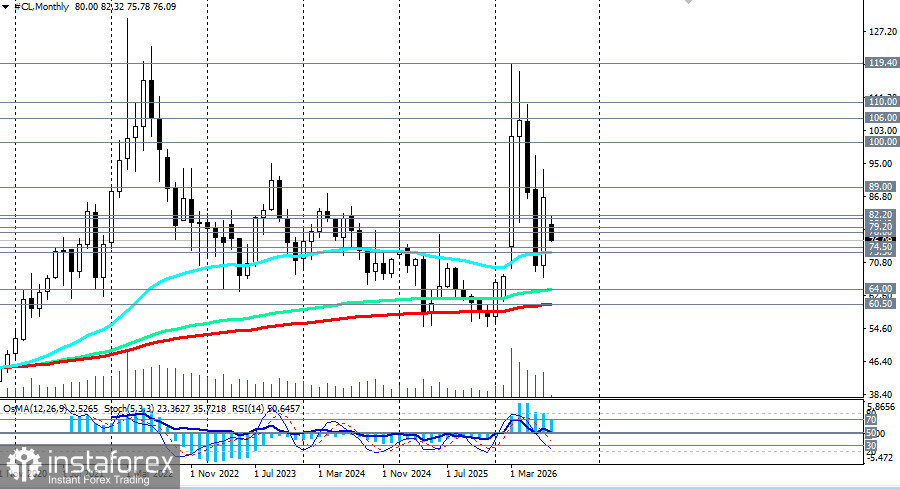
WTI crude is at a pivotal juncture, where geopolitical de-escalation and fundamental factors are weighing on prices, though risks remain elevated. The key driver remains the situation surrounding US-Iran negotiations, with any sign of progress potentially sending prices crashing toward $73-70, while a breakdown in talks could push oil back to $80-85.
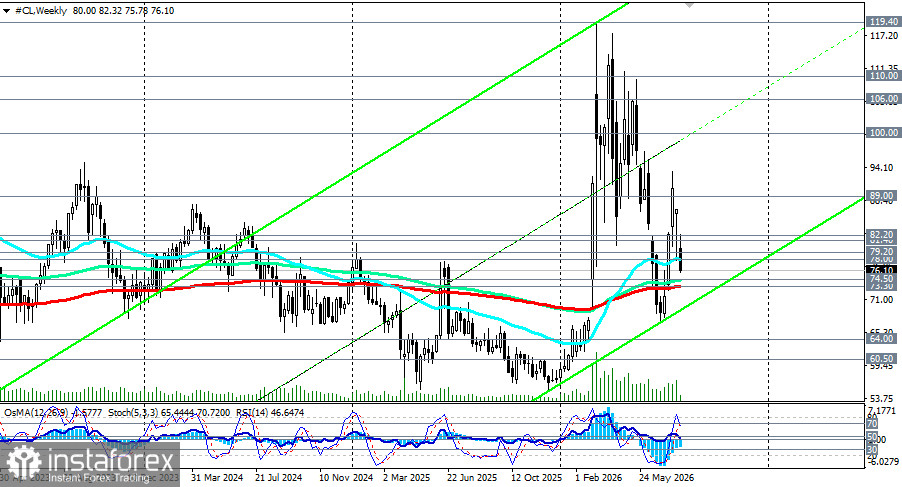
On the daily chart:
The bearish scenario would materialize on a break below 75.00, opening the path to 74.50 (the weekly EMA144) and 73.30 (the weekly EMA200). A break of these levels would push prices into a long-term bearish market phase, making short positions preferable over the longer term, with targets near 64.00-60.50 (the monthly EMA144 and EMA200).
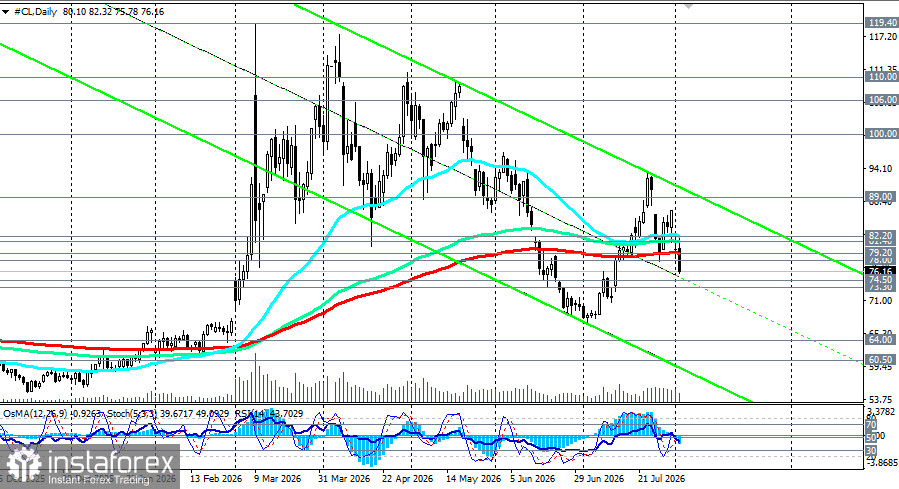
Conditions for realization:
The bullish scenario would materialize on a break above the immediate resistance levels of 78.00 (weekly EMA50) and the 80.00 mark (psychological level). For the market to move into a bullish phase, the price needs to overcome the resistance zone of 82.20-83.00.
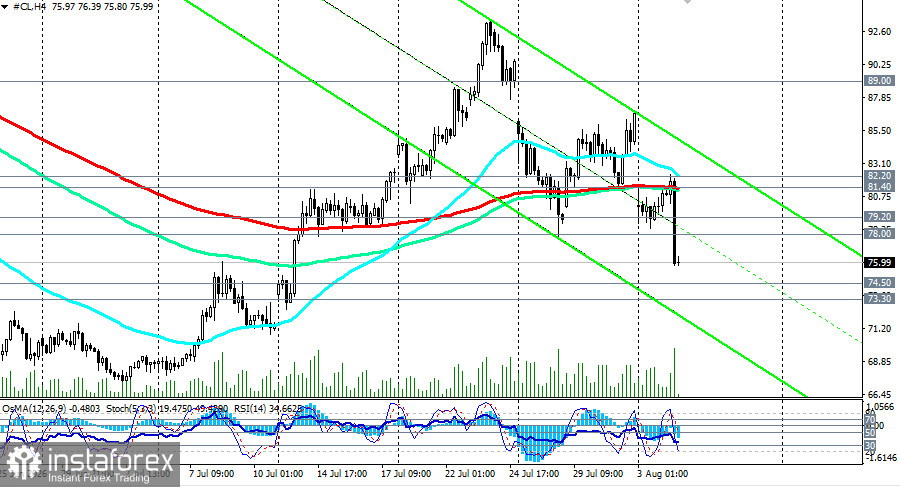
Conditions for realization:
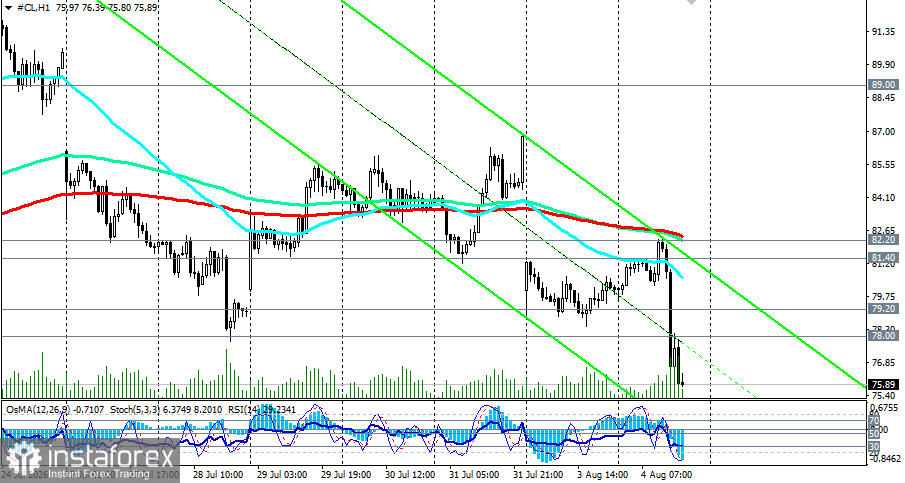
Target zone: 80.00, then 83.00 and 86.00.
Trading scenarios:
Bearish scenario (WTI downside): Sell Stop 75.00 (break of support). Stop-Loss 77.50. Targets 74.50, 73.50, 70.00, 64.00, 60.50.
Bullish scenario (WTI upside): Buy Stop 77.50, 80.50. Stop-Loss 75.00. Targets 82.00, 83.50, 86.00.
*Here, "Targets" correspond to support/resistance levels. This does not imply they will necessarily be reached but may serve as a guide for planning and positioning trades.
*The market analysis posted here is meant to increase your awareness, but not to give instructions to make a trade.
InstaSpot analytical reviews will make you fully aware of market trends! Being an InstaSpot client, you are provided with a large number of free services for efficient trading.


