


Aktuelni obrasci

Obrasci su grafički modeli koje cene formiraju na grafikonu. Prema jednom od postulata tehničke analize, istorija (kretanja cene) se ponavlja. To znači da su kretanja cene često slična u istim situacijama što omogućava predviđanje daljeg kretanja u situacijama sa velikom verovatnoćom.
InstaSpot-ovi važni obrasci su servis lak za korišćenje koji omogućava da budete u toku sa najnovijim promenama na tržištu i da blagovremeno reagujete na signalne znake sa tržišta. U našem servisu uvek možete pronaći najnovije i najvažnije obrasce svakog valutnog para i sa bilo kojim vremenskim okvirom.
Bearish Rectangle
was formed on 10.04 at 14:40:41 (UTC+0)
signal strength 1 of 5
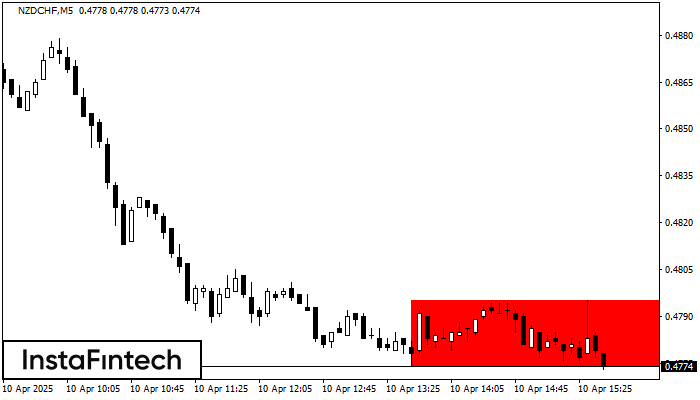
According to the chart of M5, NZDCHF formed the Bearish Rectangle. The pattern indicates a trend continuation. The upper border is 0.4795, the lower border is 0.4774. The signal means that a short position should be opened after fixing a price below the lower border 0.4774 of the Bearish Rectangle.
The M5 and M15 time frames may have more false entry points.

