




The legend in the InstaSpot team!
Legend! You think that's bombastic rhetoric? But how should we call a man, who became the first Asian to win the junior world chess championship at 18 and who became the first Indian Grandmaster at 19? That was the start of a hard path to the World Champion title for Viswanathan Anand, the man who became a part of history of chess forever. Now one more legend in the InstaSpot team!





Borussia is one of the most titled football clubs in Germany, which has repeatedly proved to fans: the spirit of competition and leadership will certainly lead to success. Trade in the same way that sports professionals play the game: confidently and actively. Keep a "pass" from Borussia FC and be in the lead with InstaSpot!

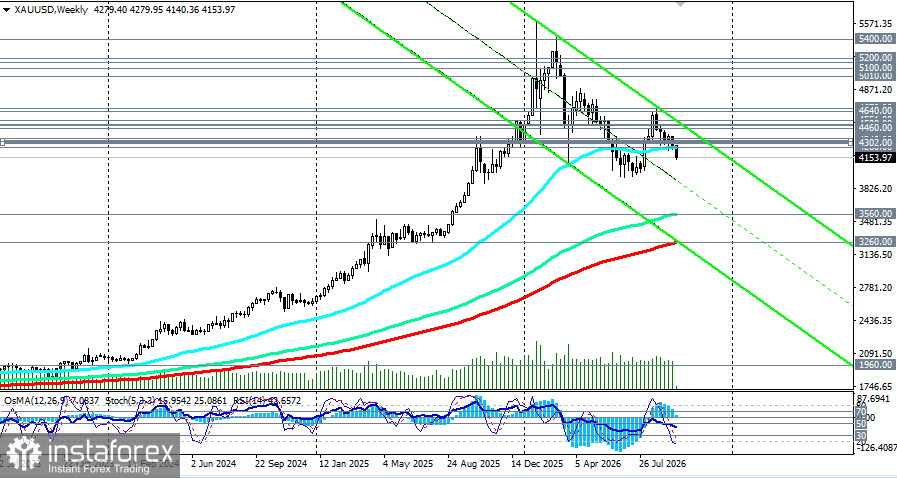
At the start of the US session on Monday, gold trades near an eight-week low and the 4,150.00 mark, remaining under pressure from the oil shock and hawkish Federal Reserve expectations.
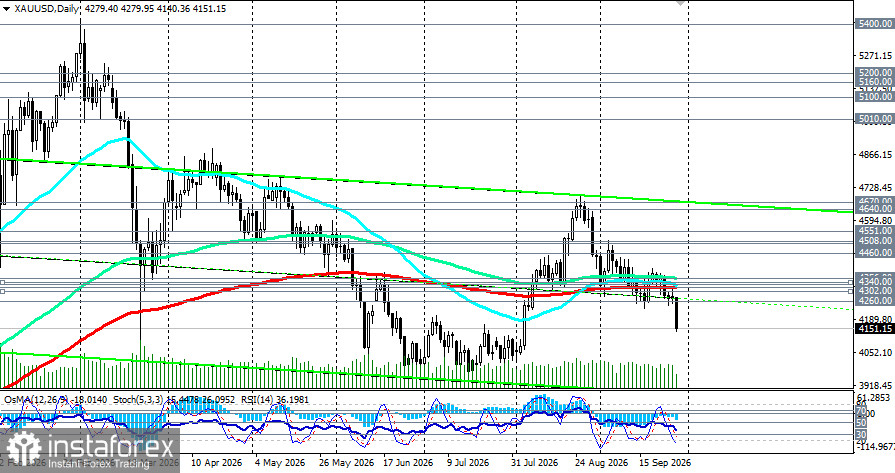
The technical picture remains bearish. Gold trades below key moving averages, and indicators point to ongoing selling pressure, albeit with signs of oversold conditions: RSI(14) on the daily chart is around 36–37, just above the oversold area; on the 4-hour chart, it is near 25, indicating deep oversold readings. OsMA shows a negative histogram confirming seller dominance, and Stochastic sits in the oversold zone, which may foreshadow a technical bounce.
Short positions are favored in the current environment. However, initiating new shorts in the context of strong oversold readings — as with buying — carries elevated risk.
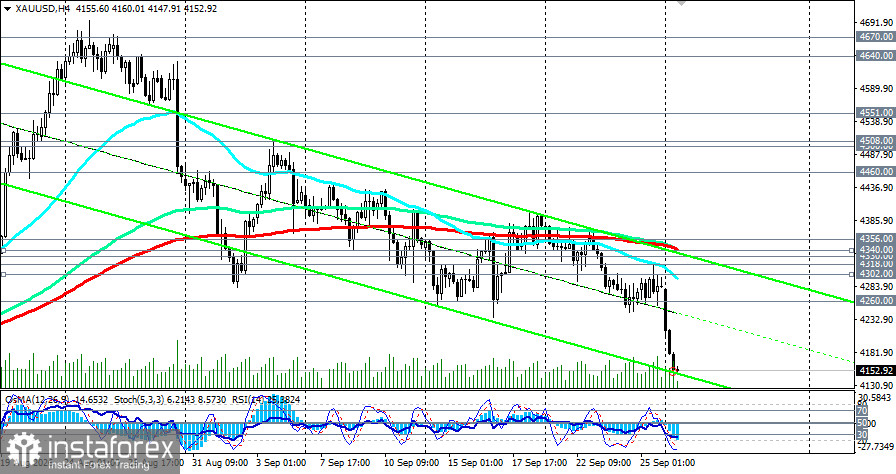
At the same time, a signal to initiate new short positions could be today's low at 4,140.00 with a target at 4,100.00. A break below 4,100.00 would open the way to 4,000.00 and then to local support at 3,940.00.
In a rebound, price could climb to the nearest resistance zone at 4,194.00 (200-EMA on the 5-minute chart)–4,200.00. This is the area to take the first tranche of short-profit. A further upside target could be 4,260.00 (50-EMA on the weekly chart). Only a sustained rise above the key resistance at 4,318.00 (200-EMA on the daily chart) would likely restore buyers' confidence and return the price to the mid-term bullish zone.
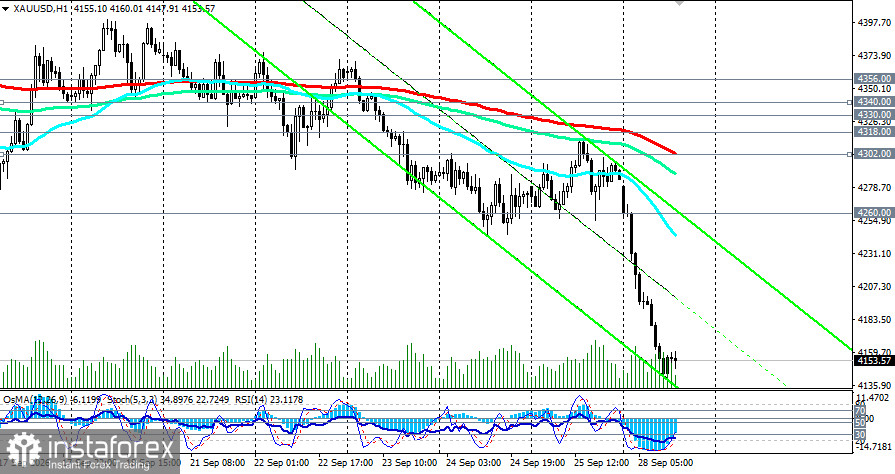
Most likely path (base case): consolidation in the 4,150.00–4,260.00 range with a bearish tilt until PCE and NFP are released. A breakout above the upper boundary would open the way to 4,300.00–4,302.00 (200-EMA on H1); a break below the lower boundary would target 4,100.00 and then 4,000.00.
Note: "Targets" correspond to support/resistance levels. This does not mean they will necessarily be reached, but they can serve as reference points for planning and placing trades.
*Analiza tržišta koja se ovde nalazi namenjena je boljem razumevanju tržišta i ne pruža instrukcije za vršenje trgovanja.
Uz InstaSpot-ove analitičke preglede uvek ćete biti u toku sa tržišnim trendovima! Klijentima InstaSpot-a su dostupni mnogobrojni besplatni servisi za uspešno trgovanje.


