




Naš tim čini više od 7.000.000 trgovaca!
Svakog dana zajedno radimo na unapređenju trgovanja. Ostvarujemo vrhunske rezultate i krećemo se samo napred.
Priznatost od strane miliona trgovaca širom sveta najbolje pokazuje koliko se naš rad ceni! Napravili ste svoj izbor i mi ćemo učiniti sve što je neophodno da zadovoljimo vaša očekivanja!
Zajedno činimo sjajan tim!
InstaSpot. Sa ponosom radi za Vas!





Glumac, šampion UFC turnira i pravi heroj!
Čovek koji je ostvario sebe. Čovek koji hoda uz nas.
Tajna uspeha Taktarova jeste stalno kretanje ka svom cilju.
Otkrijte sve strane svog talenta!
Istražuj, pokušaj, padni - ali se nikad ne zaustavljaj!
InstaSpot. Priča Vašeg uspeha započinje ovde!

Bitcoin remains around $77,500, clearly intent on continuing the bullish trend established last week. Ethereum is also trading near $2,500.
As shown by the latest SoSoValue report, spot Bitcoin ETFs closed the week with an inflow of $1.92 billion. This is the best weekly result since October of last year.

This figure logically caps off a series of events that unfolded over the past seven days, including the Treasury's decision to double its repurchase of long-term bonds, Trump's meeting with crypto industry leaders at the White House, a record wave of short liquidations totaling $3 billion, and the return of Strategy reserves to profit for the first time since spring. It is precisely such a large inflow, rather than a single day's spike, that may serve as necessary confirmation that the price surge is based on real institutional demand, rather than merely a technical squeeze of shorts.
The significance of this result is especially noticeable against the backdrop of what was happening just a month ago. An eight-week streak of net outflows persisted from mid-May, cumulatively taking about $8.3 billion from the market, and the annual balance of inflows and outflows remained deeply negative throughout most of the summer. October 2025, which is now being compared to the current result, was the month when Bitcoin reached a historic high above $126,000, marking a peak of institutional enthusiasm before a prolonged correction began. The return of weekly inflows to comparable volumes after almost a year of decline confirms that large capital perceives the current price level not as a local bounce but as a sufficiently stable opportunity for new investments through the regulated ETF infrastructure.
Regarding short-term trading, the strategy and conditions are described below.
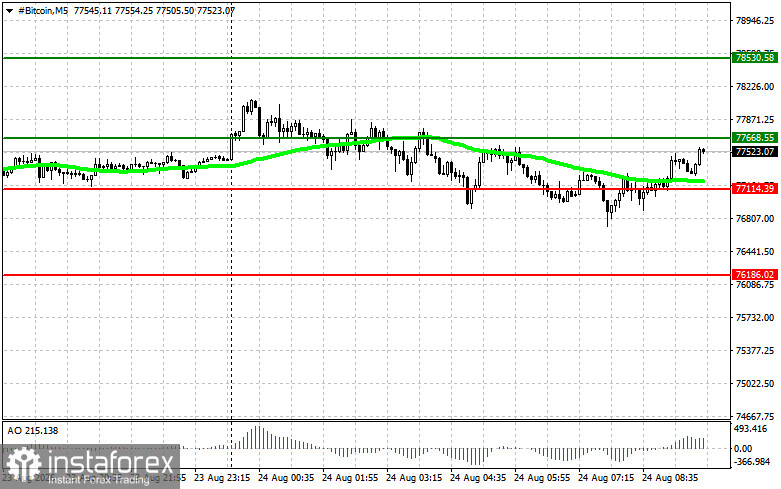
Scenario No. 1: I plan to buy Bitcoin today upon reaching an entry point around $77,600 with a target for growth to the level of $78,500. Around $78,500, I will exit from buy positions and sell immediately on the rise. Before buying on the breakout, ensure that the 50-day moving average is below the current price and that the Awesome indicator is in the zone above zero.
Scenario No. 2: You can buy Bitcoin from the lower boundary of $77,100 if there is no market reaction to its breakout back to levels $77,600 and $78,500.
Scenario No. 1: I plan to sell Bitcoin today upon reaching an entry point around $77,100 with a target for a drop to the level of $76,100. Around $76,100, I will exit from sell positions and buy immediately on the rise. Before selling on the breakout, ensure that the 50-day moving average is above the current price and that the Awesome indicator is in the zone below zero.
Scenario No. 2: You can sell Bitcoin from the upper boundary of $77,600 if there is no market reaction to its breakout back to levels $77,100 and $76,100.
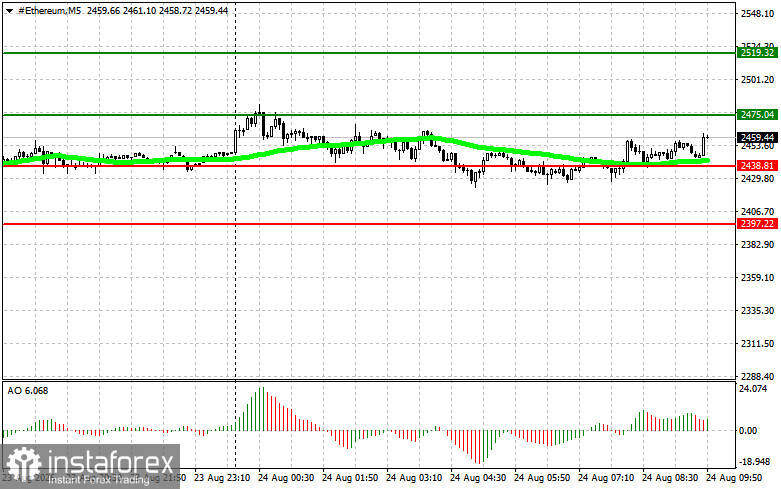
Scenario No. 1: I plan to buy Ethereum today upon reaching an entry point around $2,475 with a target for growth to the level of $2,519. Around $2,519, I will exit from buy positions and sell immediately on the rise. Before buying on the breakout, ensure that the 50-day moving average is below the current price and that the Awesome indicator is in the zone above zero.
Scenario No. 2: You can buy Ethereum from the lower boundary of $2,438 if there is no market reaction to its breakout back to levels $2,475 and $2,519.
Scenario No. 1: I plan to sell Ethereum today upon reaching an entry point around $2,438 with a target for a drop to the level of $2,397. Around $2,397, I will exit from sell positions and buy immediately on the rise. Before selling on the breakout, ensure that the 50-day moving average is above the current price and that the Awesome indicator is in the zone below zero.
Scenario No. 2: You can sell Ethereum from the upper boundary of $2,475 if there is no market reaction to its breakout back to levels $2,438 and $2,397.
*Analiza tržišta koja se ovde nalazi namenjena je boljem razumevanju tržišta i ne pruža instrukcije za vršenje trgovanja.
Uz InstaSpot-ove analitičke preglede uvek ćete biti u toku sa tržišnim trendovima! Klijentima InstaSpot-a su dostupni mnogobrojni besplatni servisi za uspešno trgovanje.


