




Naš tim čini više od 7.000.000 trgovaca!
Svakog dana zajedno radimo na unapređenju trgovanja. Ostvarujemo vrhunske rezultate i krećemo se samo napred.
Priznatost od strane miliona trgovaca širom sveta najbolje pokazuje koliko se naš rad ceni! Napravili ste svoj izbor i mi ćemo učiniti sve što je neophodno da zadovoljimo vaša očekivanja!
Zajedno činimo sjajan tim!
InstaSpot. Sa ponosom radi za Vas!





Glumac, šampion UFC turnira i pravi heroj!
Čovek koji je ostvario sebe. Čovek koji hoda uz nas.
Tajna uspeha Taktarova jeste stalno kretanje ka svom cilju.
Otkrijte sve strane svog talenta!
Istražuj, pokušaj, padni - ali se nikad ne zaustavljaj!
InstaSpot. Priča Vašeg uspeha započinje ovde!

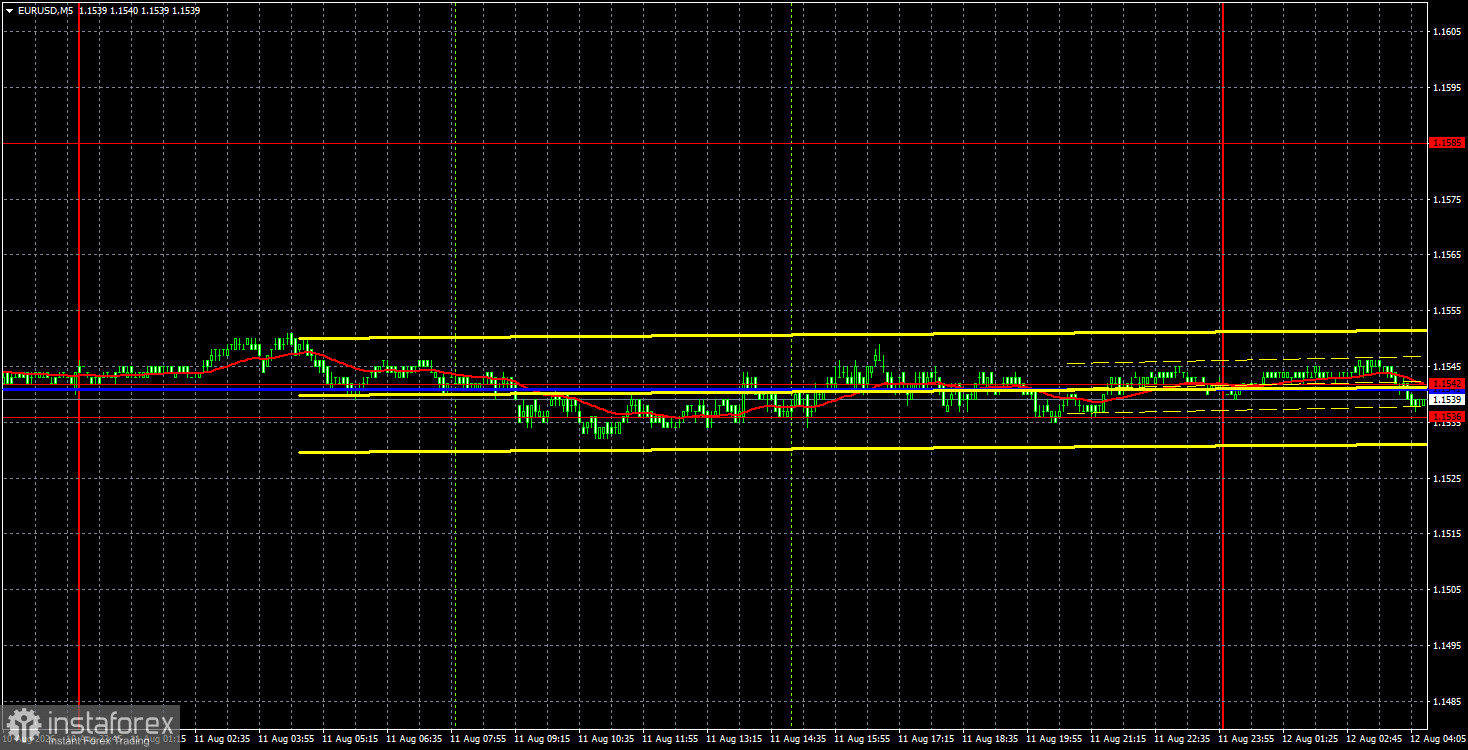
The EUR/USD currency pair did not move on Tuesday, August 11. Not at all. Volatility during the day amounted to less than 20 pips. The pair on Monday moved into the 1.1536–1.1542 area and, for a second day, has been trading essentially within it. There is no trending movement. The macroeconomic and fundamental background is absent.
Yesterday in the US, two secondary reports were published, but we immediately warned that there would be no reaction to them. Today, the inflation report will be released, and since the start of the week, it has been clear that traders are waiting specifically for that indicator. US inflation will allow certain conclusions about the next Federal Reserve meeting, although, in our view, everything is already pretty clear. Since the US labor market has been weakening for four consecutive months, we believe the Fed will not tighten monetary policy in September, regardless of the inflation reading. Of course, we should not rush to conclusions. Before the September Fed meeting, at least one more Nonfarm Payrolls report and another inflation report (in addition to today's) will be released. So the situation in September may change. But at the moment we see no grounds for raising the Fed's key rate.
Technically, the pair left the 1.1362–1.1461 sideways channel after a month of "suffering" and is in an upward trend. The euro is generally rising, but we believe this is insufficient. The dollar currently has virtually no trump cards. It is only saved by the fact that it is the world's most popular currency, which, a priori, prevents it from collapsing every day.
On the 5-minute timeframe on Tuesday, not a single trading signal was formed. The pair slid on Monday into the 1.1536–1.1542 area and has been trading inside or near it for more than a day.
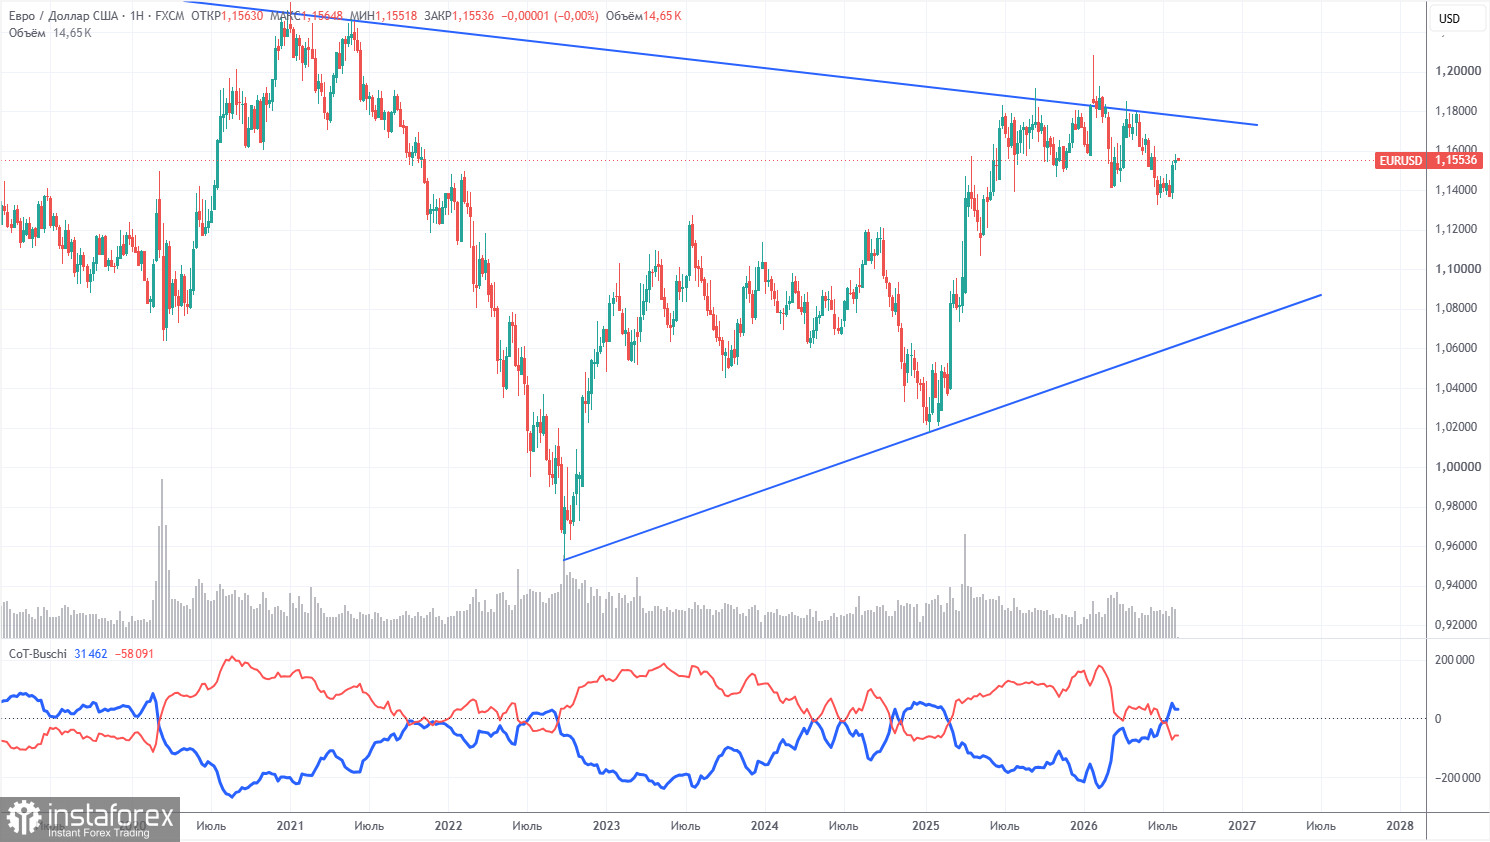
The latest COT report is dated August 4. In the weekly TF illustration, it is clear that the net position of non-commercial traders has become "bearish" and has significantly decreased in 2026 due to geopolitical events. Traders have been unloading the euro in recent months in favor of the US dollar. Donald Trump's policy has not changed, but the dollar has, for a time, acted as a "reserve currency."
We still do not see any fundamental factors to strengthen the euro, while there remain sufficient factors for the US currency to decline. The war in the Middle East made the dollar temporarily super-attractive, but when that factor expires, everything will return to normal. In the long term, the euro could fall even to 1.08$ (trend line), but the upward trend will remain relevant. And after the recent months of dollar strength, the pair has not approached that line too closely.
The placement of the red and blue lines of the indicator indicates parity between bulls and bears. During the last reporting week, the number of longs in the "Non-commercial" group decreased by 3,100, while the number of shorts decreased by 17,500. Accordingly, the net position for the week increased by 14,400 contracts.
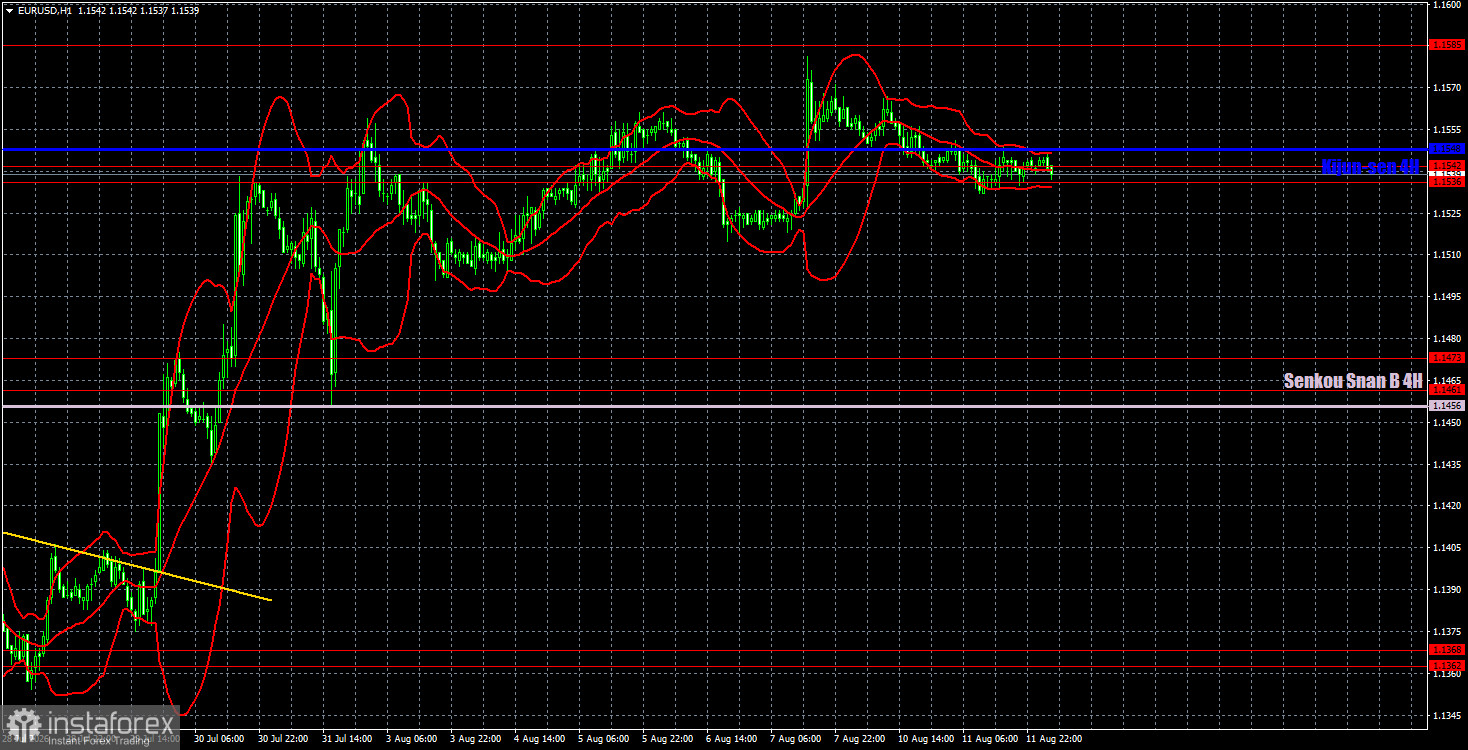
On the hourly timeframe, the pair continues the upward trend after a monthly pause. The situation in the Middle East remains tense and is not improving, but this is no longer sufficient for a new, powerful rise in the dollar. In recent months, the market ignored all euro-positive background and focused only on Fed monetary policy, imposing excessive expectations on it. Now the veil is lifting from the traders' eyes, so the euro has every chance for medium-term growth.
For August 12 we highlight the following levels for trading — 1.1234, 1.1274, 1.1362–1.1368, 1.1461–1.1473, 1.1536–1.1542, 1.1585, 1.1657–1.1666, 1.1750–1.1760, 1.1786, 1.1830–1.1837, as well as the Senkou Span B (1.1458) and Kijun-sen (1.1546) lines. The Ichimoku indicator lines may move during the day, which should be taken into account when determining trading signals. Do not forget to move the stop loss to breakeven if the price moves 15 pips in the correct direction. This will protect against potential losses if the signal proves false.
On Wednesday, the US inflation report for July will be published, and this report is the "event of the week." We do not doubt that a reaction to this publication will follow, regardless of the indicator's value. The market is now deliberately waiting for this report.
Today, traders may consider short positions with a target of 1.1461–1.1473 if the pair consolidates below the 1.1536–1.1542 area. Consolidation above the 1.1536–1.1548 area will allow opening long positions with targets of 1.1585 and 1.1657–1.1666.
Price support and resistance levels (resistance/support) – thick red lines near which movement may end. They are not sources of trading signals.
Kijun-sen and Senkou Span B lines – Ichimoku indicator lines transferred from the 4-hour to the hourly timeframe. They are strong lines.
Extreme levels – thin red lines from which price previously bounced. They are sources of trading signals.
Yellow lines – trend lines, trend channels, and any other technical patterns.
Indicator 1 on the COT charts – the size of the net position of each trader category.
*Analiza tržišta koja se ovde nalazi namenjena je boljem razumevanju tržišta i ne pruža instrukcije za vršenje trgovanja.
Uz InstaSpot-ove analitičke preglede uvek ćete biti u toku sa tržišnim trendovima! Klijentima InstaSpot-a su dostupni mnogobrojni besplatni servisi za uspešno trgovanje.


