


Naš tim čini više od 7.000.000 trgovaca!
Svakog dana zajedno radimo na unapređenju trgovanja. Ostvarujemo vrhunske rezultate i krećemo se samo napred.
Priznatost od strane miliona trgovaca širom sveta najbolje pokazuje koliko se naš rad ceni! Napravili ste svoj izbor i mi ćemo učiniti sve što je neophodno da zadovoljimo vaša očekivanja!
Zajedno činimo sjajan tim!
InstaSpot. Sa ponosom radi za Vas!


Glumac, šampion UFC turnira i pravi heroj!
Čovek koji je ostvario sebe. Čovek koji hoda uz nas.
Tajna uspeha Taktarova jeste stalno kretanje ka svom cilju.
Otkrijte sve strane svog talenta!
Istražuj, pokušaj, padni - ali se nikad ne zaustavljaj!
InstaSpot. Priča Vašeg uspeha započinje ovde!

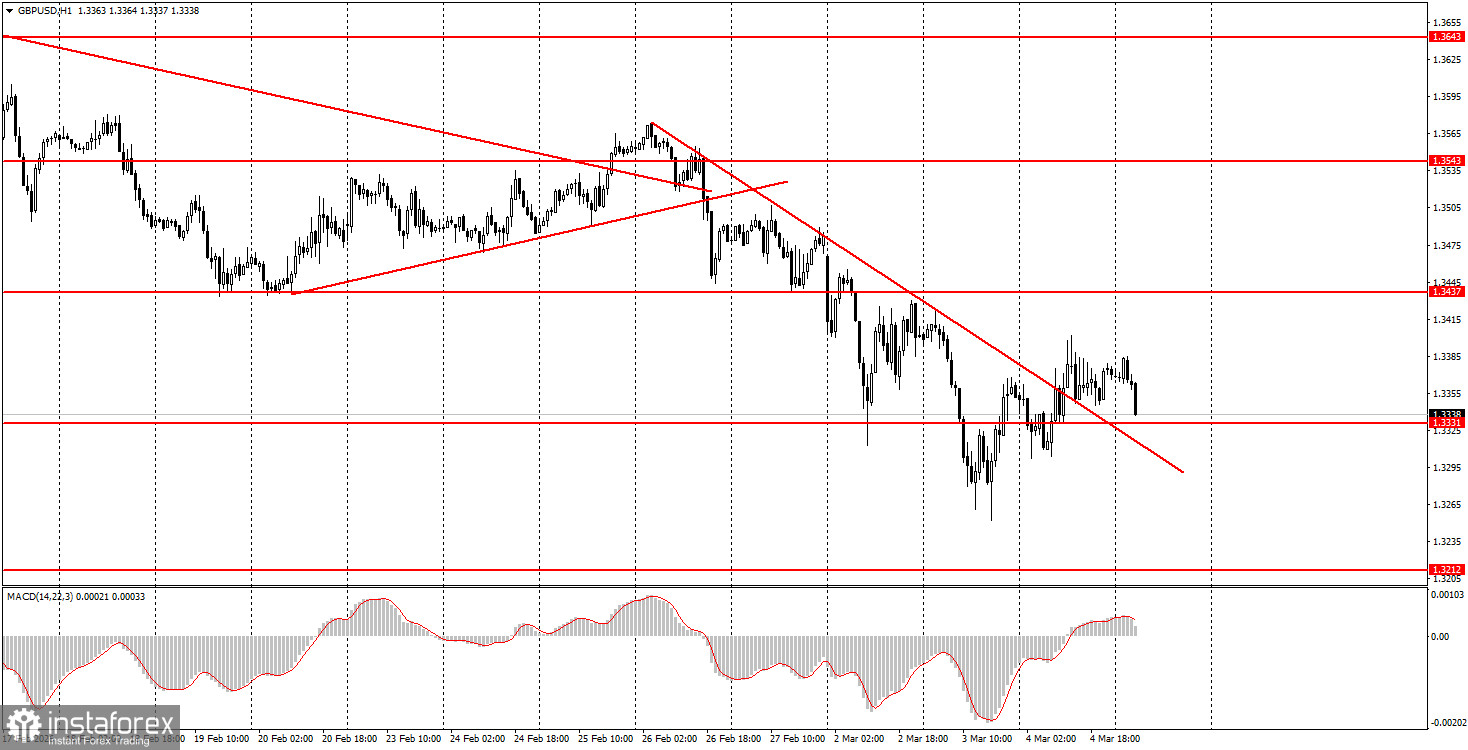
The GBP/USD pair made a slight correction on Wednesday, although it had fewer grounds for growth than the euro currency. The Eurozone reported a positive unemployment rate, while there was no significant news from the UK. Nevertheless, the GBP/USD pair broke through another descending trend line, which once again warns traders of a potential upward trend. However, over the last few weeks, similar signals have been formed multiple times, and we have yet to see an upward trend. Thus, something similar may be observed this time as well. Geopolitics continues to dominate markets, and no one can say how much longer the American currency will rise on this factor alone. Strikes between Iran and US allies continue in both directions, and it was reported yesterday that Iraq has commenced a ground operation in Iran, having entered and established itself in Iranian territory. As we can see, the conflict is intensifying day by day, and hopes for a swift resolution seem unlikely. Theoretically, the dollar may experience further rounds of growth based solely on this factor.
On the hourly timeframe, the GBP/USD pair continues to follow a "geopolitical trend." There are no global foundations for medium-term dollar growth, so in 2026, we expect the global upward trend from 2025 to continue, which could push the pair to 1.4000 at a minimum. In recent weeks, the situation has often not favored the British currency, and the market is fully focused on the war in the Middle East, which supports the rise of the American currency.
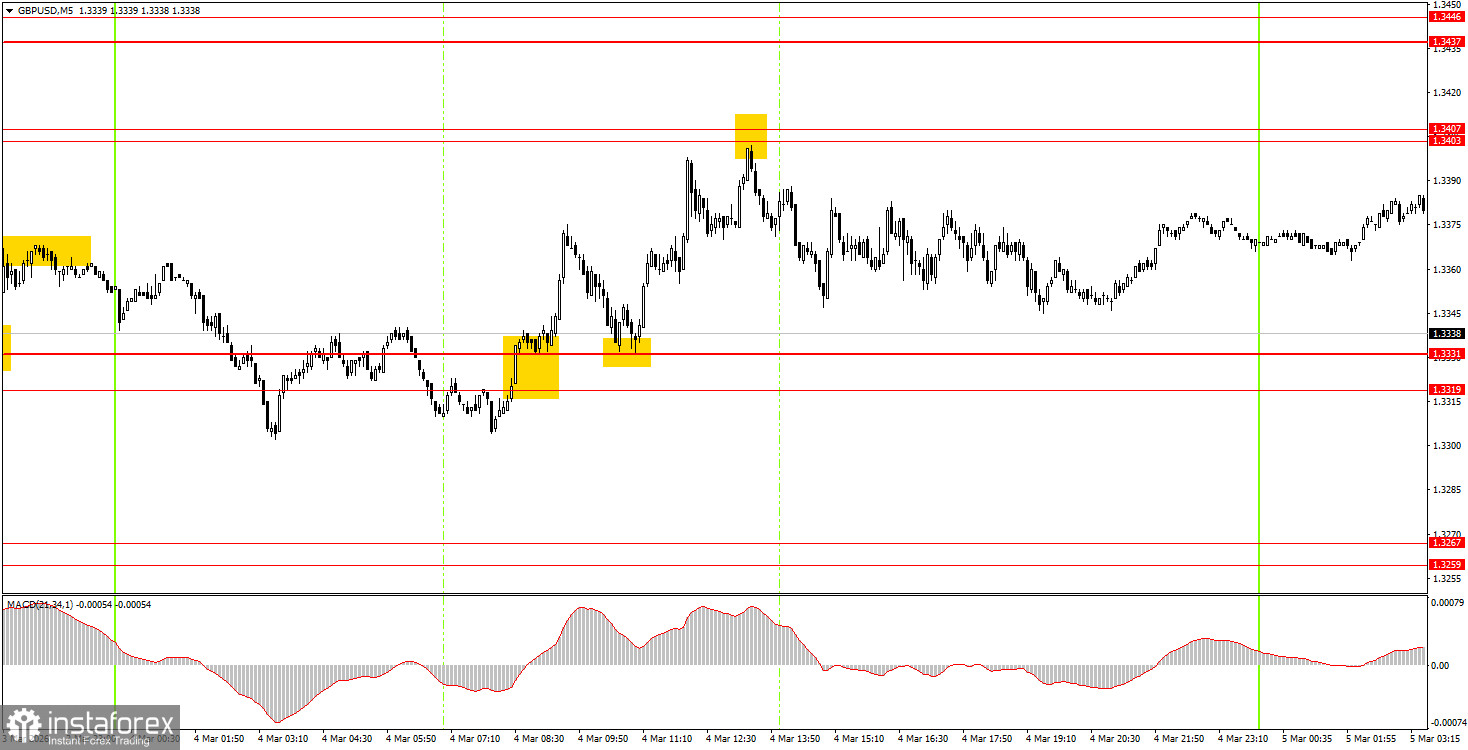
On Thursday, beginner traders may consider opening long positions if there is a bounce from the 1.3319-1.3331 area, targeting 1.3365 and 1.3403-1.3407. A consolidation below the 1.3319-1.3331 area will allow for new short positions with a target of 1.3259-1.3267.
On the 5-minute timeframe, trading can currently be conducted at levels 1.3203-1.3212, 1.3259-1.3267, 1.3319-1.3331, 1.3403-1.3407, 1.3437-1.3446, 1.3484-1.3489, 1.3529-1.3543, 1.3643-1.3652, 1.3695, 1.3741-1.3751. On Thursday, no significant events are scheduled in the UK. In the US, only a completely secondary unemployment claims report will be released. The day began with another rise for the dollar, and the direction will largely depend on the area of 1.3319-1.3331.
Price levels of support and resistance are levels that serve as targets when opening buys or sells. Take Profit levels can be placed around them.
Red lines represent channels or trend lines that show the current trend and indicate the direction in which it is preferable to trade now.
The MACD indicator (14,22,3) – the histogram and the signal line – is a supporting indicator that can also be used as a source of signals.
Important speeches and reports (always included in the news calendar) can significantly affect the movement of the currency pair. Therefore, during their release, trading should be done with utmost caution, or traders should exit the market to avoid sharp price reversals against the previous movement.
Beginning traders in the forex market should remember that not every trade can be profitable. Developing a clear strategy and effective money management are the keys to long-term trading success.
*Analiza tržišta koja se ovde nalazi namenjena je boljem razumevanju tržišta i ne pruža instrukcije za vršenje trgovanja.
Uz InstaSpot-ove analitičke preglede uvek ćete biti u toku sa tržišnim trendovima! Klijentima InstaSpot-a su dostupni mnogobrojni besplatni servisi za uspešno trgovanje.


