


The legend in the InstaSpot team!
Legend! You think that's bombastic rhetoric? But how should we call a man, who became the first Asian to win the junior world chess championship at 18 and who became the first Indian Grandmaster at 19? That was the start of a hard path to the World Champion title for Viswanathan Anand, the man who became a part of history of chess forever. Now one more legend in the InstaSpot team!


Borussia is one of the most titled football clubs in Germany, which has repeatedly proved to fans: the spirit of competition and leadership will certainly lead to success. Trade in the same way that sports professionals play the game: confidently and actively. Keep a "pass" from Borussia FC and be in the lead with InstaSpot!

Bitcoin plunged from about $90,000 to roughly $75,000 in a matter of days and shows little sign of stopping. The cryptocurrency market is clearly in the grip of a severe bear cycle, and many investors are asking what has driven such a swift decline.

The first factor is the Federal Reserve issue. Markets are pricing in a firmer path for monetary policy amid speculation that Kevin Warsh could be named Fed chair. Warsh is known for his hawkish views, and his appointment would likely signal a tougher policy stance, which weighs on risk assets such as cryptocurrencies.
The second factor is that outflows from Bitcoin and Ethereum ETFs have intensified. Those flows were a primary engine of last year's rally, and without fresh institutional inflows, the market's prospects dim. Since mid-January, large net withdrawals from Bitcoin and Ethereum exchange-traded funds accelerated, particularly ahead of the recent weekend. The loss of that systematic buyer amplified selling pressure as institutions reduced positions.
The third factor is that long position liquidations in the futures market. Breaches of key support levels triggered widespread forced selling of long futures positions. The cascade of automatic margin calls exacerbated the downward move.
The fourth factor is rising geopolitical uncertainty. Reports of potential actions by the Trump administration on Iran and Cuba contributed to investor flight from risky assets.
Finally, there was a classic panic-selling dynamic. Once the price acceleration turned negative, sentiment rapidly swung from bullish to bearish, intensifying the panic and driving prices lower.
Trading recommendations:
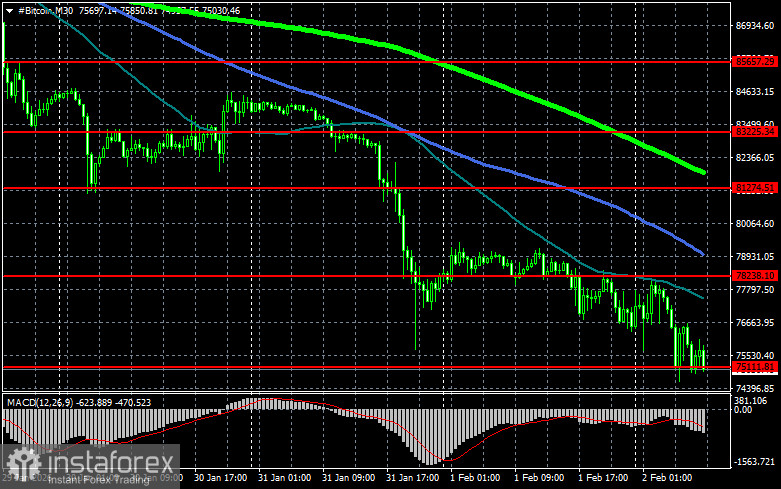
From a technical viewpoint, buyers of BTC are now targeting a return to $78,200, which would open a direct path to $81,200 and then $83,200. The farther target is the peak near $85,600. A breakout of that level would signal attempts to restore the bull market. On the downside, buyers are expected at $75,100. A breakdown below that area could quickly push BTC toward $72,100, with a further downside target near $68,900.
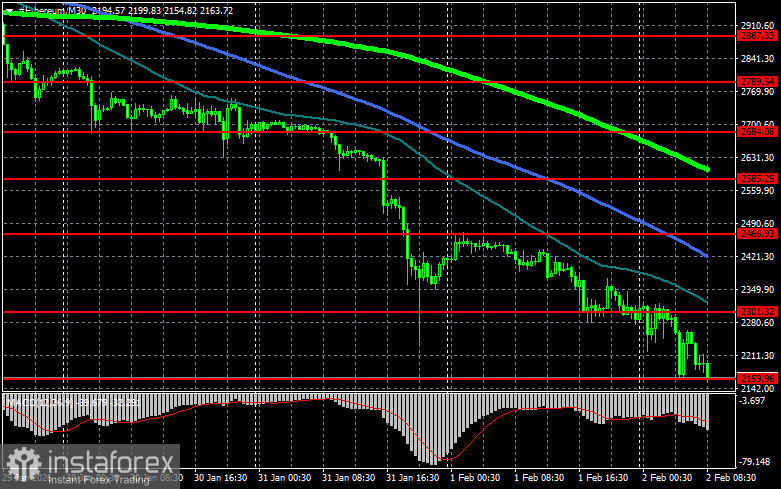
As for Ethereum, a clear consolidation above $2,301 would open a route to $2,466. The farther target is the peak near $2,585. Surpassing that level would strengthen bullish sentiment and renew buyer interest. If ETH falls, buyers are anticipated at $2,159. A move below that zone could rapidly send ETH down to about $2,017, with a farther downside target near $1,891.
What we see on the chart:
- Red lines indicate support and resistance levels where either a price slowdown or active growth is expected;
- Green lines indicate the 50-day moving average;
- Blue lines indicate the 100-day moving average;
- Light green lines indicate the 200-day moving average.
A crossover, or a price test of moving averages, typically either halts the move or sparks fresh market momentum.
*Analiza tržišta koja se ovde nalazi namenjena je boljem razumevanju tržišta i ne pruža instrukcije za vršenje trgovanja.
Uz InstaSpot-ove analitičke preglede uvek ćete biti u toku sa tržišnim trendovima! Klijentima InstaSpot-a su dostupni mnogobrojni besplatni servisi za uspešno trgovanje.


