


Naš tim čini više od 7.000.000 trgovaca!
Svakog dana zajedno radimo na unapređenju trgovanja. Ostvarujemo vrhunske rezultate i krećemo se samo napred.
Priznatost od strane miliona trgovaca širom sveta najbolje pokazuje koliko se naš rad ceni! Napravili ste svoj izbor i mi ćemo učiniti sve što je neophodno da zadovoljimo vaša očekivanja!
Zajedno činimo sjajan tim!
InstaSpot. Sa ponosom radi za Vas!


Glumac, šampion UFC turnira i pravi heroj!
Čovek koji je ostvario sebe. Čovek koji hoda uz nas.
Tajna uspeha Taktarova jeste stalno kretanje ka svom cilju.
Otkrijte sve strane svog talenta!
Istražuj, pokušaj, padni - ali se nikad ne zaustavljaj!
InstaSpot. Priča Vašeg uspeha započinje ovde!

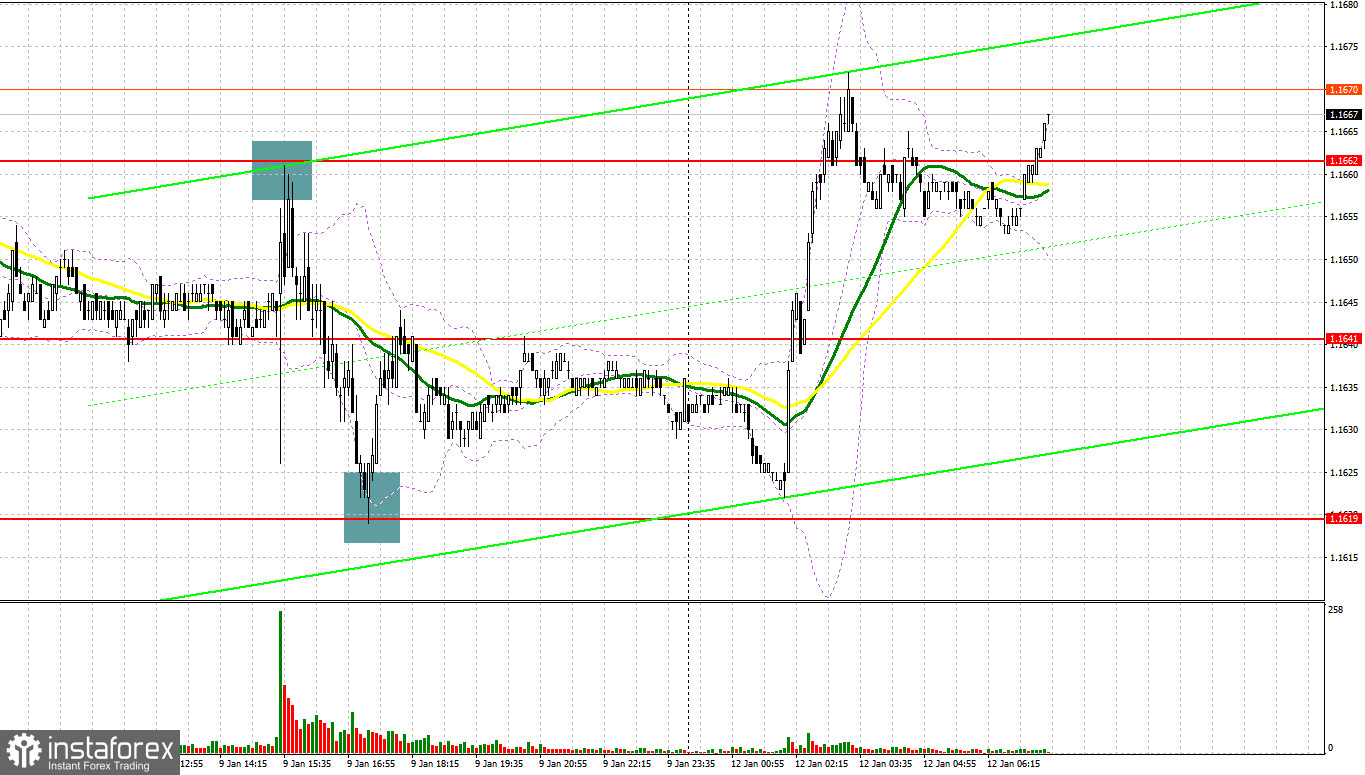
Last Friday, several market entry points were formed. Let us look at the 5-minute chart and examine what happened there. In my morning forecast, I highlighted the 1.1641 level and planned to make entry decisions based on it. The decline and the formation of a false breakout around 1.1641 provided a buy entry for the euro, resulting in a 15-pip rise in the pair. In the second half of the day, active seller activity around 1.1662 prompted a sell entry on the euro, resulting in a drop of more than 40 pips. Long positions from the 1.1619 level also allowed extracting roughly 20 pips of profit.
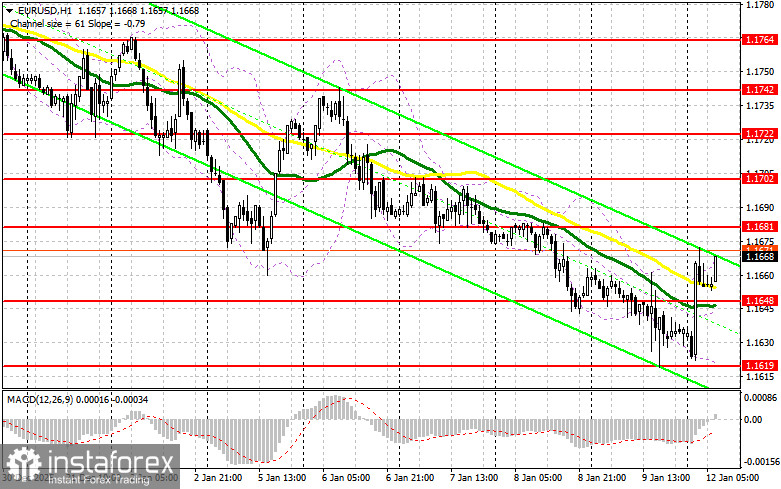
US nonfarm payrolls came in below economists' forecasts, but the unemployment rate fell to 4.4%, which temporarily strengthened the dollar against several risk assets, including the euro. Today, the only eurozone report expected is the Sentix investor confidence indicator, which is unlikely to have a significant impact on EUR/USD. This preserves buyers' chances to continue the upward correction observed since the start of today's Asian trading. On disappointing data and a fall in the pair, buyers' hopes will shift to the nearest support at 1.1648, formed last Friday. Only the formation of a false breakout there will provide an entry point for long positions against the trend, with a target of a small recovery to 1.1681. A breakout and a reversal test of that range would confirm the correct action to buy the euro with a view to a larger move to 1.1702. The farthest target will be the 1.1722 high, where I will take profit. In the case of a decline in EUR/USD and absence of activity around 1.1648, pressure on the pair will return and may lead to a larger downward move — in that case, bears will try to reach the next interesting level at 1.1619. Only if there is a false breakout will it be an appropriate condition to buy the euro. Opening longs immediately on a bounce will be from 1.1591 with a target for an intraday upward correction of 30–35 pips.
Sellers did everything possible on Friday to continue the bear market, but demand skewed strongly during today's Asian trading, which may change the pair's intraday direction. In case of euro recovery, the first manifestation of bears is expected only near resistance at 1.1681. A false breakout there will provide an entry point for shorts targeting support at 1.1648, where moving averages run and play on the bulls' side. A breakout and close below that range, followed by a reverse test from below, would be an additional trigger to open shorts toward 1.1619, which would restore the bear market. The farthest target will be the 1.1591 area, where I will take profit. If EUR/USD moves up and bears are inactive at 1.1681, buyers will get a good chance for a larger recovery. In that case, short positions are best postponed until the larger level at 1.1702. Shorts from there should be taken only after a failed consolidation. I plan to open shorts immediately on a bounce from 1.1722, targeting a 30–35-pip downward correction.
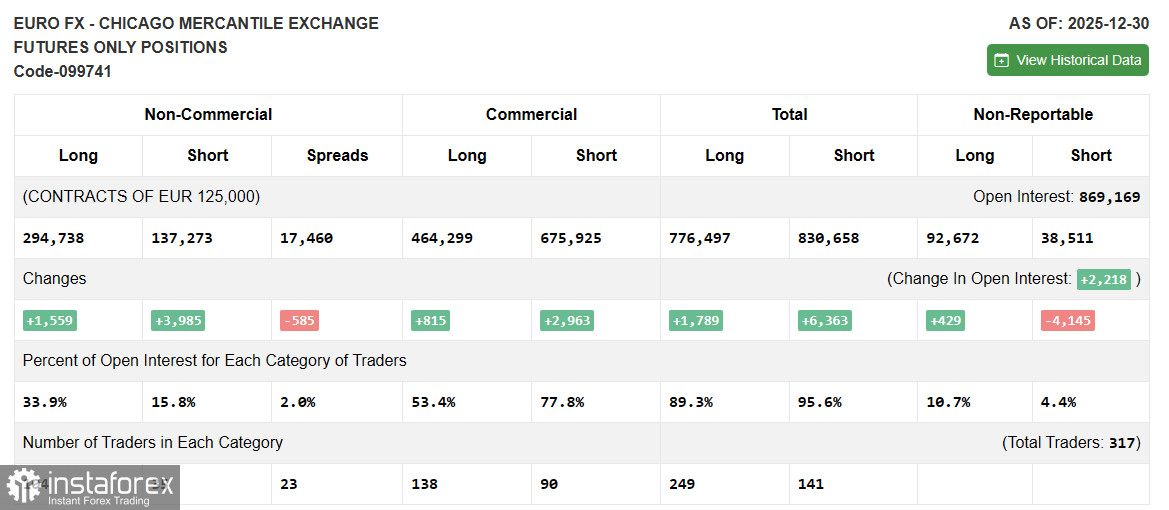
Due to the U.S. government shutdown, fresh Commitment of Traders data have not been published. As soon as an updated report is prepared, we will publish it. The latest available data are only as of December 30.
The COT report showed increases in both long and short positions. However, these data are not suitable for building the current strategy, so they do not require special attention. The COT report indicates that non-commercial long positions rose by 1,559 to 294,738, while non-commercial short positions jumped by 3,985 to 137,273. As a result, the spread between long and short positions narrowed by 585.
Moving averages
Trading is above the 30- and 50-day moving averages, indicating a possible correction in the pair.
Note: the period and price basis of the moving averages are considered by the author on the hourly H1 chart and differ from the classical daily moving averages on the D1 chart.
Bollinger Bands
In the event of a decline, support will be provided by the indicator's lower band at around 1.1619.
*Analiza tržišta koja se ovde nalazi namenjena je boljem razumevanju tržišta i ne pruža instrukcije za vršenje trgovanja.
Uz InstaSpot-ove analitičke preglede uvek ćete biti u toku sa tržišnim trendovima! Klijentima InstaSpot-a su dostupni mnogobrojni besplatni servisi za uspešno trgovanje.


