



Naš tim čini više od 7.000.000 trgovaca!
Svakog dana zajedno radimo na unapređenju trgovanja. Ostvarujemo vrhunske rezultate i krećemo se samo napred.
Priznatost od strane miliona trgovaca širom sveta najbolje pokazuje koliko se naš rad ceni! Napravili ste svoj izbor i mi ćemo učiniti sve što je neophodno da zadovoljimo vaša očekivanja!
Zajedno činimo sjajan tim!
InstaSpot. Sa ponosom radi za Vas!



Glumac, šampion UFC turnira i pravi heroj!
Čovek koji je ostvario sebe. Čovek koji hoda uz nas.
Tajna uspeha Taktarova jeste stalno kretanje ka svom cilju.
Otkrijte sve strane svog talenta!
Istražuj, pokušaj, padni - ali se nikad ne zaustavljaj!
InstaSpot. Priča Vašeg uspeha započinje ovde!

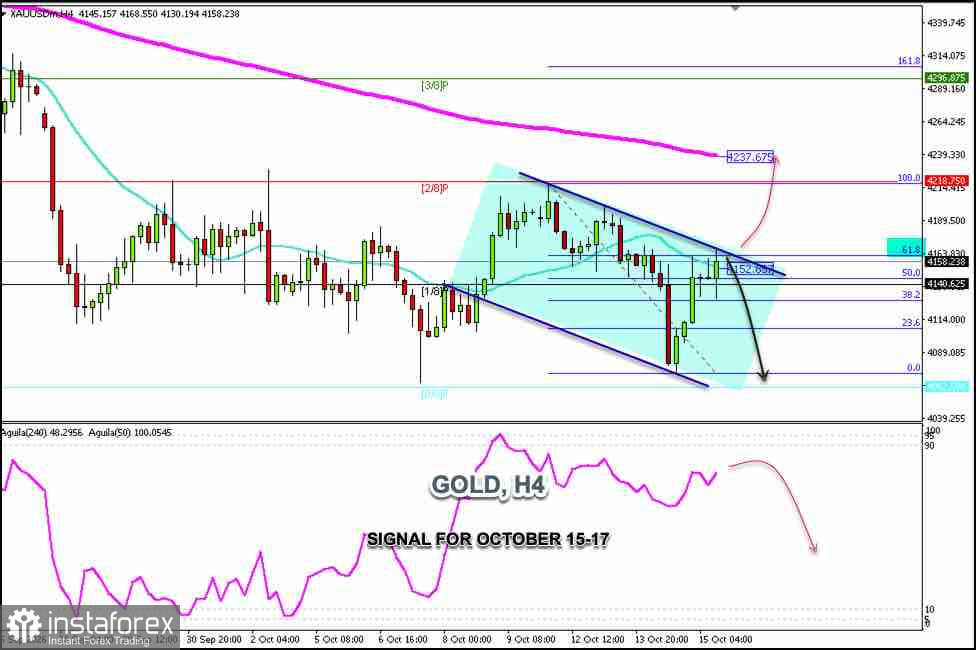
After reaching a high of $4,218, gold is currently trading around $4,158 within a downtrend channel that has been forming since October 9. Yesterday, following the release of US data, gold hit a low of $4,073, coming close to the 0/8 Murray line and the October 7 low.
Taken together, these levels suggest a possible double-bottom formation, which would imply a bullish trend and could push the price to $4,292 (near the 161.8% Fibonacci level) in the coming days.
On the H4 chart, gold reached the $4,165 area, a level that coincided with the 61.8% Fibonacci retracement and the upper band of the downtrend channel, indicating strong resistance there.
If gold consolidates below $4,170 in the coming hours, the outlook could turn negative, offering a selling opportunity with targets at $4,115 and $4,062.
Conversely, if gold breaks out of the downtrend channel and consolidates above $4,170, this could confirm a double-bottom pattern and open the path toward $4,218 and then the 200 EMA near $4,237.
Note that XAU/USD left a gap on September 23 that has not yet been filled. Therefore, consolidation above $4,220 would support a recovery and make a return toward that area more likely.
*Analiza tržišta koja se ovde nalazi namenjena je boljem razumevanju tržišta i ne pruža instrukcije za vršenje trgovanja.
Uz InstaSpot-ove analitičke preglede uvek ćete biti u toku sa tržišnim trendovima! Klijentima InstaSpot-a su dostupni mnogobrojni besplatni servisi za uspešno trgovanje.


