




Naš tim čini više od 7.000.000 trgovaca!
Svakog dana zajedno radimo na unapređenju trgovanja. Ostvarujemo vrhunske rezultate i krećemo se samo napred.
Priznatost od strane miliona trgovaca širom sveta najbolje pokazuje koliko se naš rad ceni! Napravili ste svoj izbor i mi ćemo učiniti sve što je neophodno da zadovoljimo vaša očekivanja!
Zajedno činimo sjajan tim!
InstaSpot. Sa ponosom radi za Vas!





Glumac, šampion UFC turnira i pravi heroj!
Čovek koji je ostvario sebe. Čovek koji hoda uz nas.
Tajna uspeha Taktarova jeste stalno kretanje ka svom cilju.
Otkrijte sve strane svog talenta!
Istražuj, pokušaj, padni - ali se nikad ne zaustavljaj!
InstaSpot. Priča Vašeg uspeha započinje ovde!

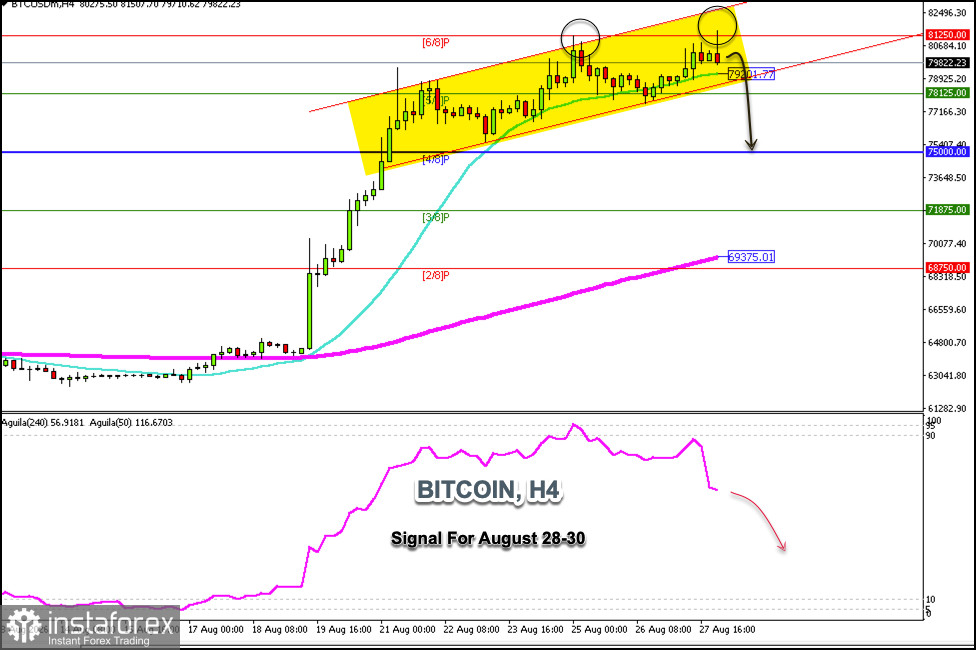
Bitcoin is trading around $79,822, pulling back after hitting the strong Murray 6/8 resistance level, and we can also see on the H4 chart that BTC has formed a double-top pattern.
This double-top pattern could signal a downtrend for Bitcoin, but for this to occur, we would need confirmation if BTC trades below $78,125, where the 5/8 Murray level is located.
If there is a drop below the 21 SMA, Bitcoin could continue to fall in the coming days, with a pullback to the 61.8% Fibonacci level likely, and it could eventually reach $75,000; ultimately, we expect it to reach the psychological level of $70,000.
Conversely, as long as Bitcoin stages a technical rebound above $79,000—around the lower band of the uptrend channel—this could be seen as a buy signal in the coming days, with the expectation that it will reach $81,250 and could even hit the upper band of the uptrend channel, which is around $82,900.
Bitcoin is currently overbought, and the Eagle indicator is showing a negative signal. Therefore, if BTC makes another attempt to break through the 6/8 Murray level and fails to overcome this zone, we could view this level as an opportunity to sell Bitcoin, with short-term targets at $70,000.
*Analiza tržišta koja se ovde nalazi namenjena je boljem razumevanju tržišta i ne pruža instrukcije za vršenje trgovanja.
Uz InstaSpot-ove analitičke preglede uvek ćete biti u toku sa tržišnim trendovima! Klijentima InstaSpot-a su dostupni mnogobrojni besplatni servisi za uspešno trgovanje.


