




The legend in the InstaSpot team!
Legend! You think that's bombastic rhetoric? But how should we call a man, who became the first Asian to win the junior world chess championship at 18 and who became the first Indian Grandmaster at 19? That was the start of a hard path to the World Champion title for Viswanathan Anand, the man who became a part of history of chess forever. Now one more legend in the InstaSpot team!





Borussia is one of the most titled football clubs in Germany, which has repeatedly proved to fans: the spirit of competition and leadership will certainly lead to success. Trade in the same way that sports professionals play the game: confidently and actively. Keep a "pass" from Borussia FC and be in the lead with InstaSpot!

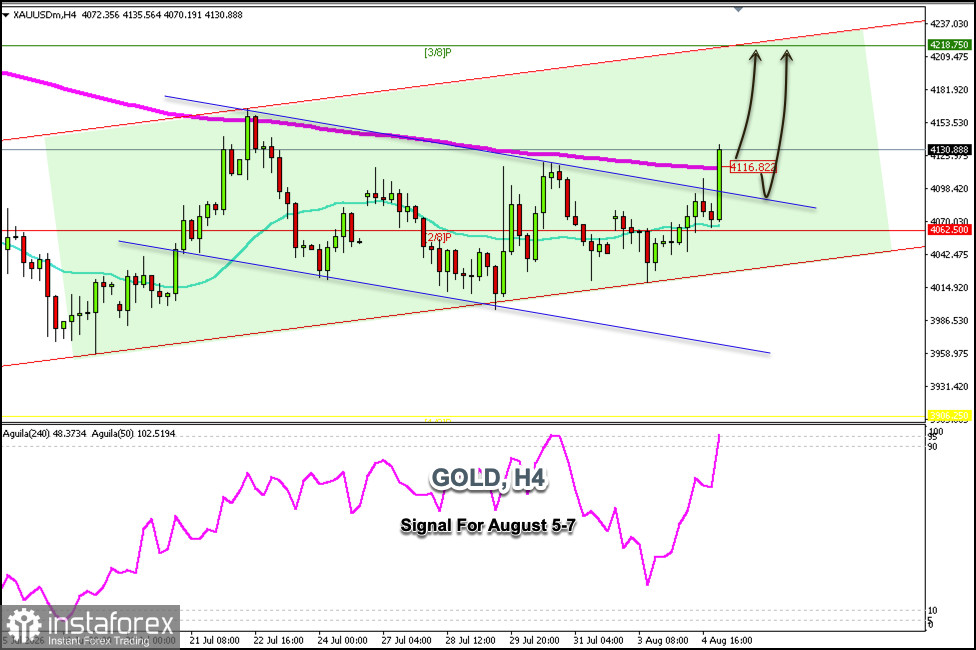
Gold is trading around $4,130, above the downtrend channel formed since July 22 and within the uptrend channel formed since early July, showing a positive bias.
On the H4 chart, we can see that gold has decisively broken out of the downtrend channel and is also consolidating above the 200-period moving average, so it is likely to continue rising in the coming days and could reach the 3/8 Murray level around $4,218.
If gold falls to the upper band of the downtrend channel around $4,080, we could expect a technical bounce, which could be considered an opportunity to open long positions in anticipation of it reaching the upper band of the uptrend channel at $4,220.
Given that gold is showing a positive signal, we could look for opportunities to buy above the 200-day moving average around $4,116 or, in case of a pullback toward the resistance level that was broken around $4,080, to open long positions.
Conversely, a drop below $4,080 could trigger a technical correction toward the lower band of the uptrend channel around $4,040.
The Eagle indicator is reaching overbought levels, so we should be cautious if gold encounters resistance around $4,140; we could expect consolidation below this zone over the next few hours.
*Analiza tržišta koja se ovde nalazi namenjena je boljem razumevanju tržišta i ne pruža instrukcije za vršenje trgovanja.
Uz InstaSpot-ove analitičke preglede uvek ćete biti u toku sa tržišnim trendovima! Klijentima InstaSpot-a su dostupni mnogobrojni besplatni servisi za uspešno trgovanje.


