


The legend in the InstaSpot team!
Legend! You think that's bombastic rhetoric? But how should we call a man, who became the first Asian to win the junior world chess championship at 18 and who became the first Indian Grandmaster at 19? That was the start of a hard path to the World Champion title for Viswanathan Anand, the man who became a part of history of chess forever. Now one more legend in the InstaSpot team!


Borussia is one of the most titled football clubs in Germany, which has repeatedly proved to fans: the spirit of competition and leadership will certainly lead to success. Trade in the same way that sports professionals play the game: confidently and actively. Keep a "pass" from Borussia FC and be in the lead with InstaSpot!

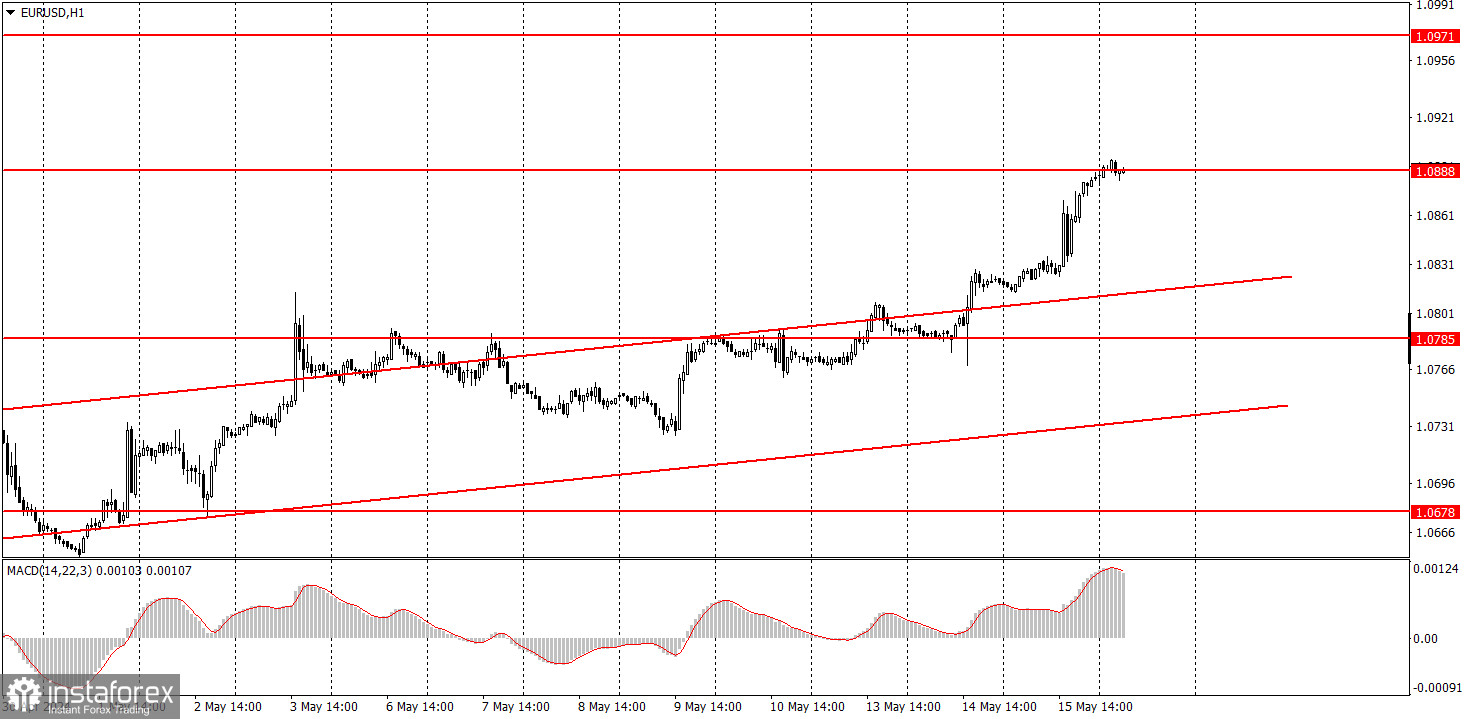
The EUR/USD continued its upward movement on Wednesday, and it traded even higher. Yesterday proved the obvious fact: the market has started to interpret any event, any news in favor of the euro. Earlier this week, we mentioned that the euro continues to rise, practically without corrections, and the market simply ignores all the positive news for the US currency. On Wednesday, we saw the same situation. The EU released fairly neutral reports on GDP and industrial production. The second estimate of GDP did not differ from the first, and industrial output exceeded forecasts by only 0.1%.
The US released its inflation report for April, and its value completely coincided with forecasts. Thus, there was no reason to sell the dollar. Moreover, a minor slowdown does not mean that the Federal Reserve will immediately start talking about rate cuts again. A value of 3.4% means that we are still far from the first easing of monetary policy. Nevertheless, the market reacted as if Fed Chair Jerome Powell had announced that the central bank is ready to lower the rate in the near future. When in fact he just stated the opposite this week...
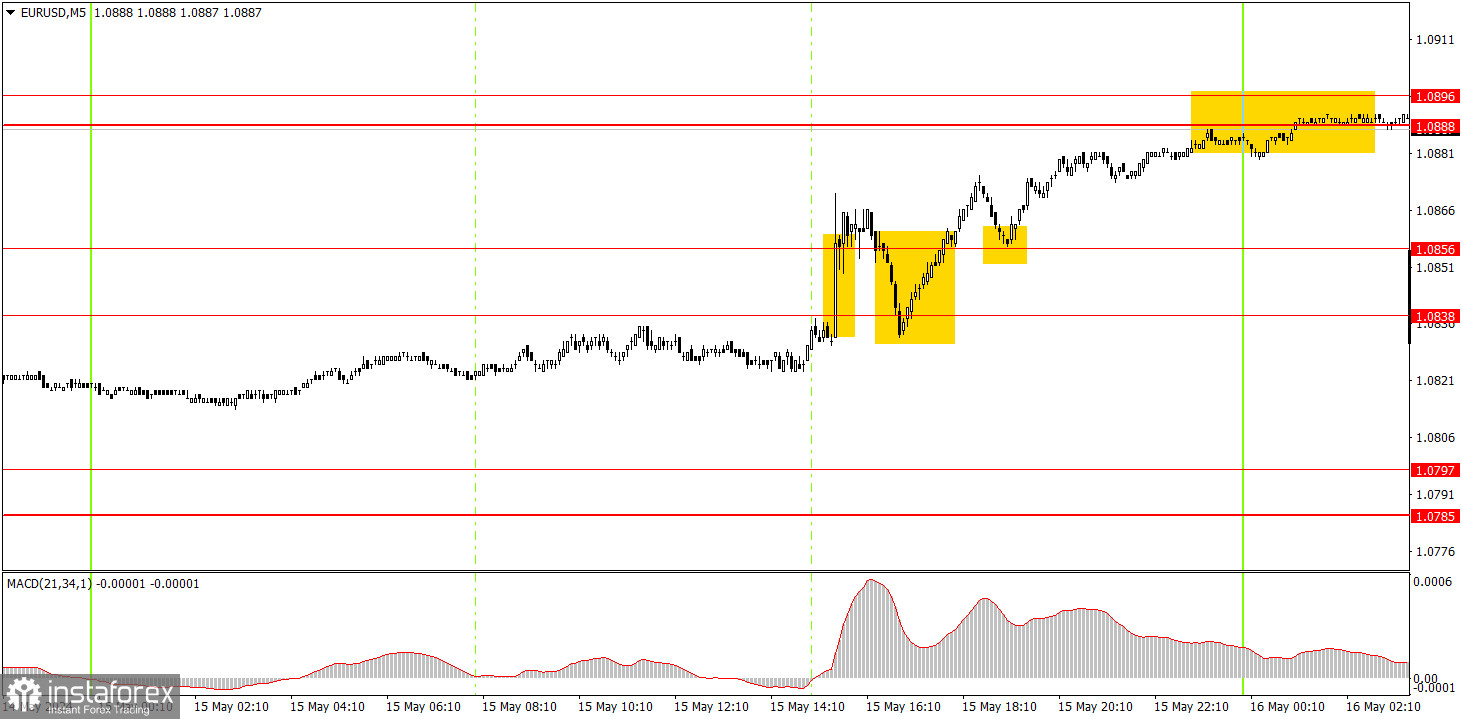
Several not-so-great signals were formed on the 5-minute timeframe. The market repeatedly changed direction after the release of the inflation report. Initially, the price surpassed the range of 1.0836-1.0856, then there was a rebound from it, followed by another one. Therefore, novice traders could open long positions during the US session. Closer to the night, the pair reached the nearest target level of 1.0888.
On the hourly chart, the EUR/USD pair continues to correct higher, which is increasingly resembling an independent trend. We believe that the decline should resume in the medium term, as the euro remains expensive, and in general, the global trend is downward. The fundamental background still supports the US dollar, and the inflation report for April will not change the Fed's stance.
On Thursday, novice traders can continue to look for buy signals around the area of 1.0888-1.0896. The growth is stable, and the market either ignores or interprets the macroeconomic background in favor of the euro.
The key levels on the 5M chart are 1.0483, 1.0526, 1.0568, 1.0611, 1.0678, 1.0725-1.0733, 1.0785-1.0797, 1.0838-1.0856, 1.0888-1.0896, 1.0940, 1.0971-1.0981. Today, there are no significant events in the European Union. The US docket only features secondary reports. However, as we can see, the market doesn't need a basis to buy the euro and sell the dollar.
1) Signal strength is determined by the time taken for its formation (either a bounce or level breach). A shorter formation time indicates a stronger signal.
2) If two or more trades around a certain level are initiated based on false signals, subsequent signals from that level should be disregarded.
3) In a flat market, any currency pair can produce multiple false signals or none at all. In any case, the flat trend is not the best condition for trading.
4) Trading activities are confined between the onset of the European session and mid-way through the U.S. session, after which all open trades should be manually closed.
5) On the 30-minute timeframe, trades based on MACD signals are only advisable amidst substantial volatility and an established trend, confirmed either by a trendline or trend channel.
6) If two levels lie closely together (ranging from 5 to 15 pips apart), they should be considered as a support or resistance zone.
Support and Resistance price levels can serve as targets when buying or selling. You can place Take Profit levels near them.
Red lines represent channels or trend lines, depicting the current market trend and indicating the preferable trading direction.
The MACD(14,22,3) indicator, encompassing both the histogram and signal line, acts as an auxiliary tool and can also be used as a signal source.
Significant speeches and reports (always noted in the news calendar) can profoundly influence the price dynamics. Hence, trading during their release calls for heightened caution. It may be reasonable to exit the market to prevent abrupt price reversals against the prevailing trend.
Beginning traders should always remember that not every trade will yield profit. Establishing a clear strategy coupled with sound money management is the cornerstone of sustained trading success.
*Analiza tržišta koja se ovde nalazi namenjena je boljem razumevanju tržišta i ne pruža instrukcije za vršenje trgovanja.
Uz InstaSpot-ove analitičke preglede uvek ćete biti u toku sa tržišnim trendovima! Klijentima InstaSpot-a su dostupni mnogobrojni besplatni servisi za uspešno trgovanje.


