


Naš tim čini više od 7.000.000 trgovaca!
Svakog dana zajedno radimo na unapređenju trgovanja. Ostvarujemo vrhunske rezultate i krećemo se samo napred.
Priznatost od strane miliona trgovaca širom sveta najbolje pokazuje koliko se naš rad ceni! Napravili ste svoj izbor i mi ćemo učiniti sve što je neophodno da zadovoljimo vaša očekivanja!
Zajedno činimo sjajan tim!
InstaSpot. Sa ponosom radi za Vas!


Glumac, šampion UFC turnira i pravi heroj!
Čovek koji je ostvario sebe. Čovek koji hoda uz nas.
Tajna uspeha Taktarova jeste stalno kretanje ka svom cilju.
Otkrijte sve strane svog talenta!
Istražuj, pokušaj, padni - ali se nikad ne zaustavljaj!
InstaSpot. Priča Vašeg uspeha započinje ovde!

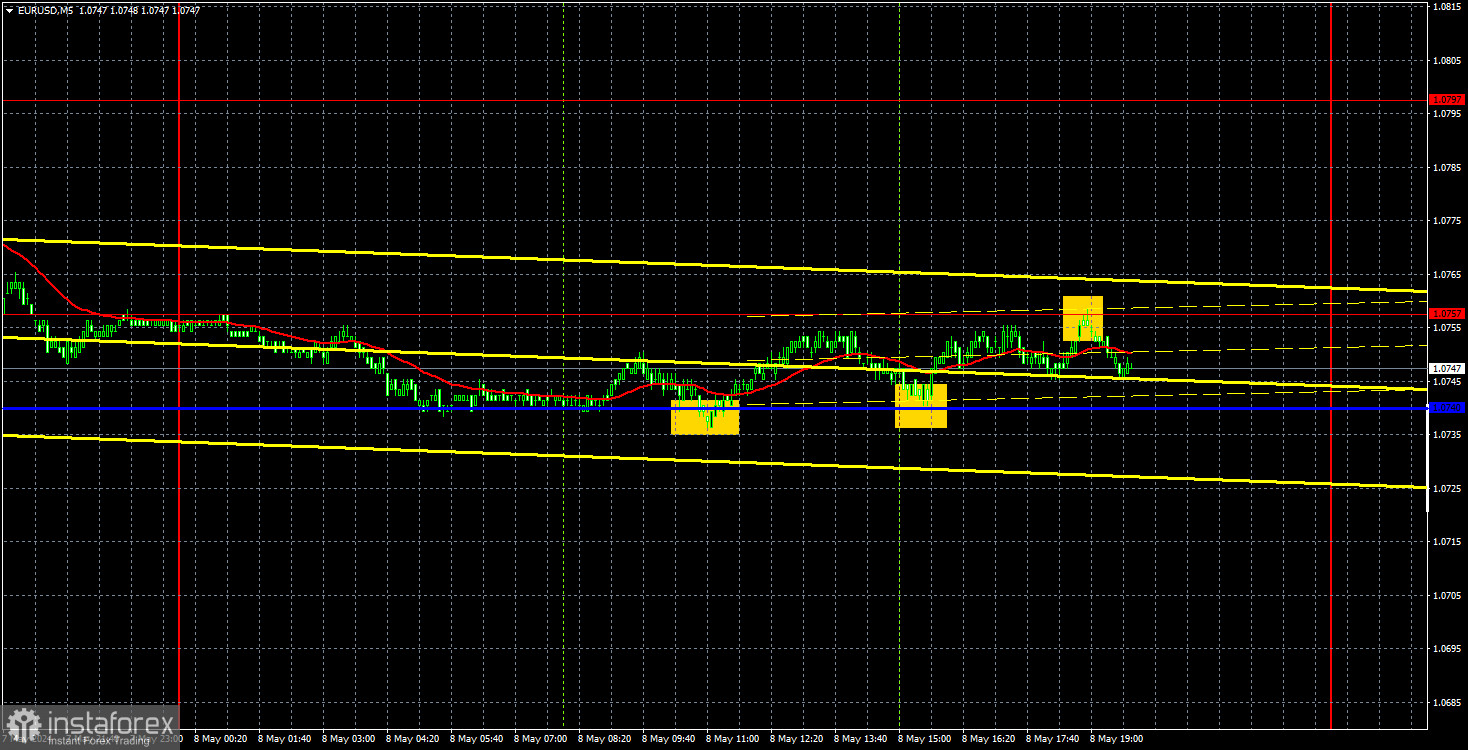
EUR/USD did not show any interesting movements on Wednesday. Volatility was less than 30 pips, which is slightly less than the last two days. Despite the minor downward movement, seeing such movements makes one want to close the trading terminal. What kind of profit can traders expect if the price barely moves 30 pips a day?
There were no scheduled reports in the European Union or the United States. Representatives of the Federal Reserve and the European Central Bank spoke, but judging by the pair's movements, their speeches did not generate any interest from the market. However, as we have already mentioned, market participants already understand what to expect from both central banks in the coming months. Therefore, we believe that another phase of the bullish correction within the global downward trend is coming to an end. From the current price levels, we expect the pair to resume the downward movement with the first target at 1.0620. However, this level is not the euro's final stop on its way down. We believe that the pair is quite capable of dropping to the range of $1.00-1.04.
There isn't much to say about Wednesday's trading signals. The price bounced off the critical line twice, and in both cases, it failed to reach even the nearest level of 1.0757, which was 17 pips away. The price only managed to reach this level in the evening. In general, there is nothing more to say because there were basically no movements. The Kijun-sen line has already lost its relevance. In the last couple of days, we have observed movements that were very similar to a flat.
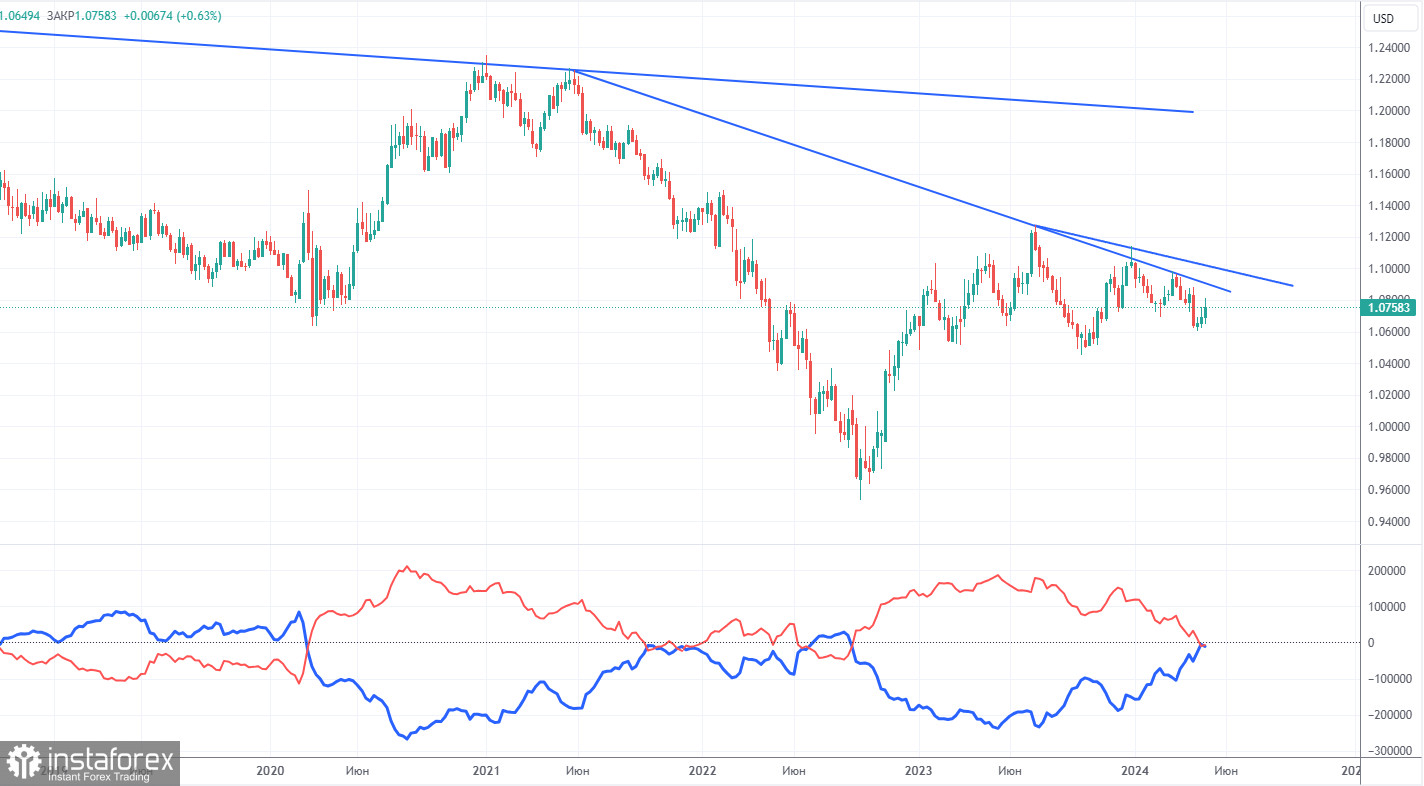
The latest COT report is dated April 30. The net position of non-commercial traders has been bullish for quite some time, but now the situation has finally changed. The net position of non-commercial traders (red line) has been decreasing in recent months, while that of commercial traders (blue line) has been increasing. This shows that market sentiment is turning bearish, as speculators increasingly sell the euro. Currently, their positions coincide in terms of volume. We don't see any fundamental factors that can support the euro's strength, while technical analysis also suggests a downtrend. Three descending trend lines on the weekly chart indicate that there's a good chance of sustaining the decline.
The red and blue lines have crossed, and now bears may have a significant advantage. So we strongly believe that the euro will fall further. During the last reporting week, the number of long positions for the non-commercial group decreased by 100, while the number of short positions decreased by 3,200. Accordingly, the net position increased by 3,100. Overall, both the euro and the net position continue to decline. The number of buy contracts is now lower than the number of sell contracts among non-commercial traders by 7,000.
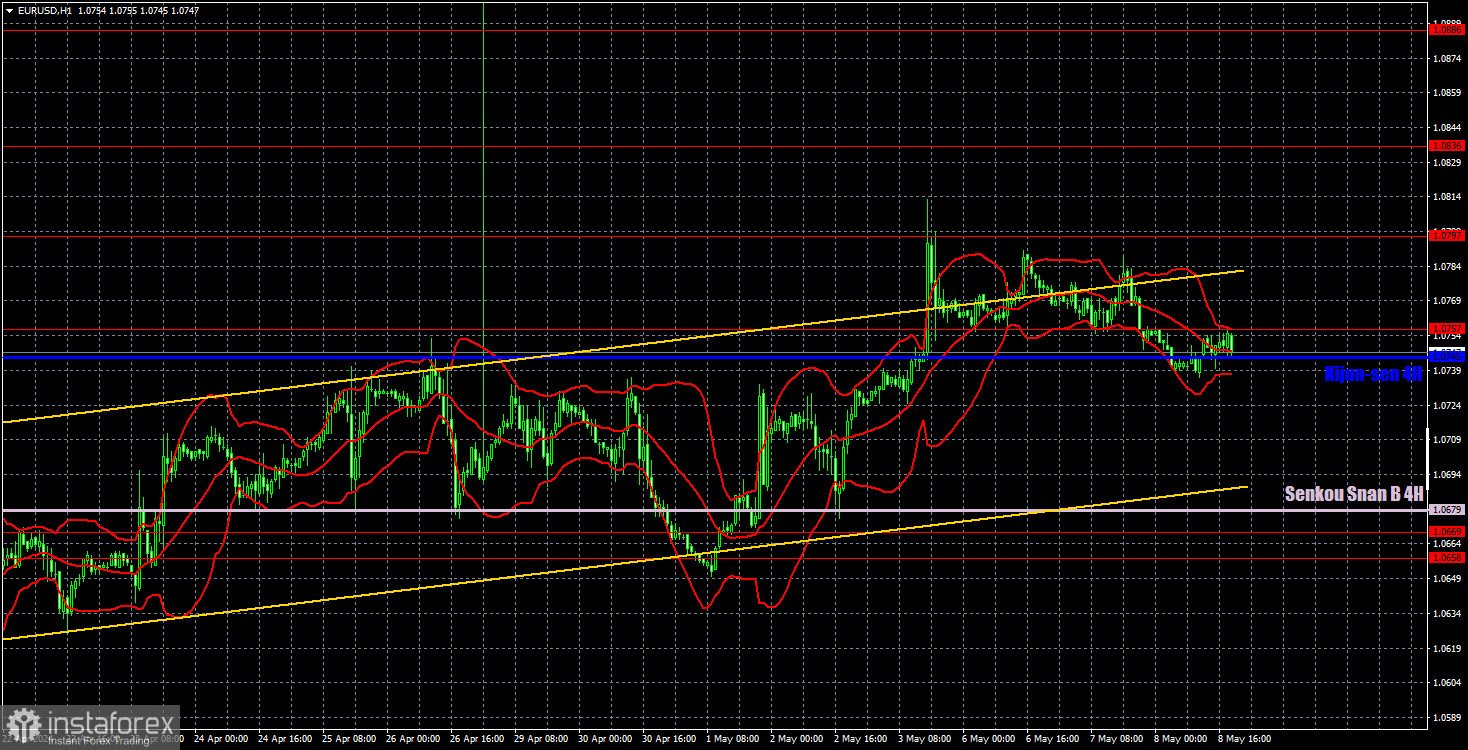
On the 1-hour chart, the EUR/USD pair has been going through a weak bullish correction against a global downward trend for three weeks now. Since expectations for a Federal Reserve rate cut in 2024 have significantly decreased, the US currency should rise in the medium term. We still expect the current correction to end (when the price consolidates below the ascending channel), and after that traders can consider selling the pair again. The targets in the 1.00-1.02 range remain unchanged for now.
On May 9, we highlight the following levels for trading: 1.0530, 1.0581, 1.0658-1.0669, 1.0757, 1.0797, 1.0836, 1.0886, 1.0935, 1.1006, 1.1092, as well as the Senkou Span B line (1.0679) and the Kijun-sen line (1.0745). The Ichimoku indicator lines can move during the day, so this should be taken into account when identifying trading signals. Don't forget to set a Stop Loss to breakeven if the price has moved in the intended direction by 15 pips. This will protect you against potential losses if the signal turns out to be false.
On Thursday, there are no crucial reports. Fortunately, the Bank of England meeting and BoE Governor Andrew Bailey's speech is scheduled for today. This may provoke volatility in the pound, and in turn, the British currency could influence the euro.
Support and resistance levels are thick red lines near which the trend may end. They do not provide trading signals;
The Kijun-sen and Senkou Span B lines are the lines of the Ichimoku indicator, plotted to the 1H timeframe from the 4H one. They provide trading signals;
Extreme levels are thin red lines from which the price bounced earlier. They provide trading signals;
Yellow lines are trend lines, trend channels, and any other technical patterns;
Indicator 1 on the COT charts is the net position size for each category of traders;
*Analiza tržišta koja se ovde nalazi namenjena je boljem razumevanju tržišta i ne pruža instrukcije za vršenje trgovanja.
Uz InstaSpot-ove analitičke preglede uvek ćete biti u toku sa tržišnim trendovima! Klijentima InstaSpot-a su dostupni mnogobrojni besplatni servisi za uspešno trgovanje.


