


Naš tim čini više od 7.000.000 trgovaca!
Svakog dana zajedno radimo na unapređenju trgovanja. Ostvarujemo vrhunske rezultate i krećemo se samo napred.
Priznatost od strane miliona trgovaca širom sveta najbolje pokazuje koliko se naš rad ceni! Napravili ste svoj izbor i mi ćemo učiniti sve što je neophodno da zadovoljimo vaša očekivanja!
Zajedno činimo sjajan tim!
InstaSpot. Sa ponosom radi za Vas!


Glumac, šampion UFC turnira i pravi heroj!
Čovek koji je ostvario sebe. Čovek koji hoda uz nas.
Tajna uspeha Taktarova jeste stalno kretanje ka svom cilju.
Otkrijte sve strane svog talenta!
Istražuj, pokušaj, padni - ali se nikad ne zaustavljaj!
InstaSpot. Priča Vašeg uspeha započinje ovde!

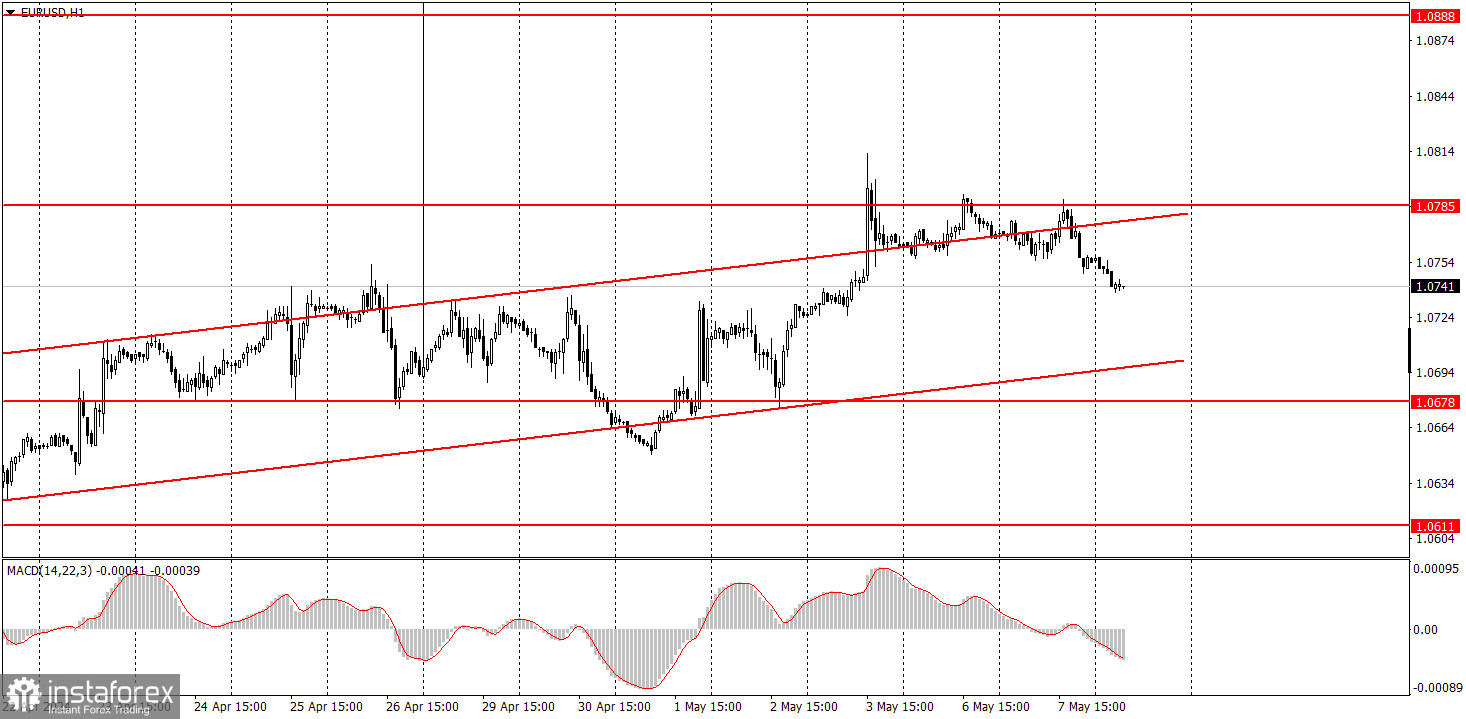
Yesterday, the EUR/USD pair failed to overcome the level of 1.0785, bouncing off it for the third time. Consequently, the euro started to fall as expected, heading towards the lower boundary of the ascending channel, which is still relevant. Take note that the recent upward movement, which has been ongoing for three weeks now, is essentially a correction, as clearly seen on higher time frames. Therefore, we expect this corrective phase to end and the euro to start a new decline.
There were no significant macroeconomic or fundamental events on Tuesday. The Eurozone retail sales report was published, showing a value of +0.8%, which is slightly higher than forecasts. However, this report did not trigger a market reaction. Or if there was a reaction, it was so weak that it was hardly noticeable. Low volatility persisted throughout the day, and the pair only started to fall towards the end of the day, which could mark the beginning of a new downtrend.
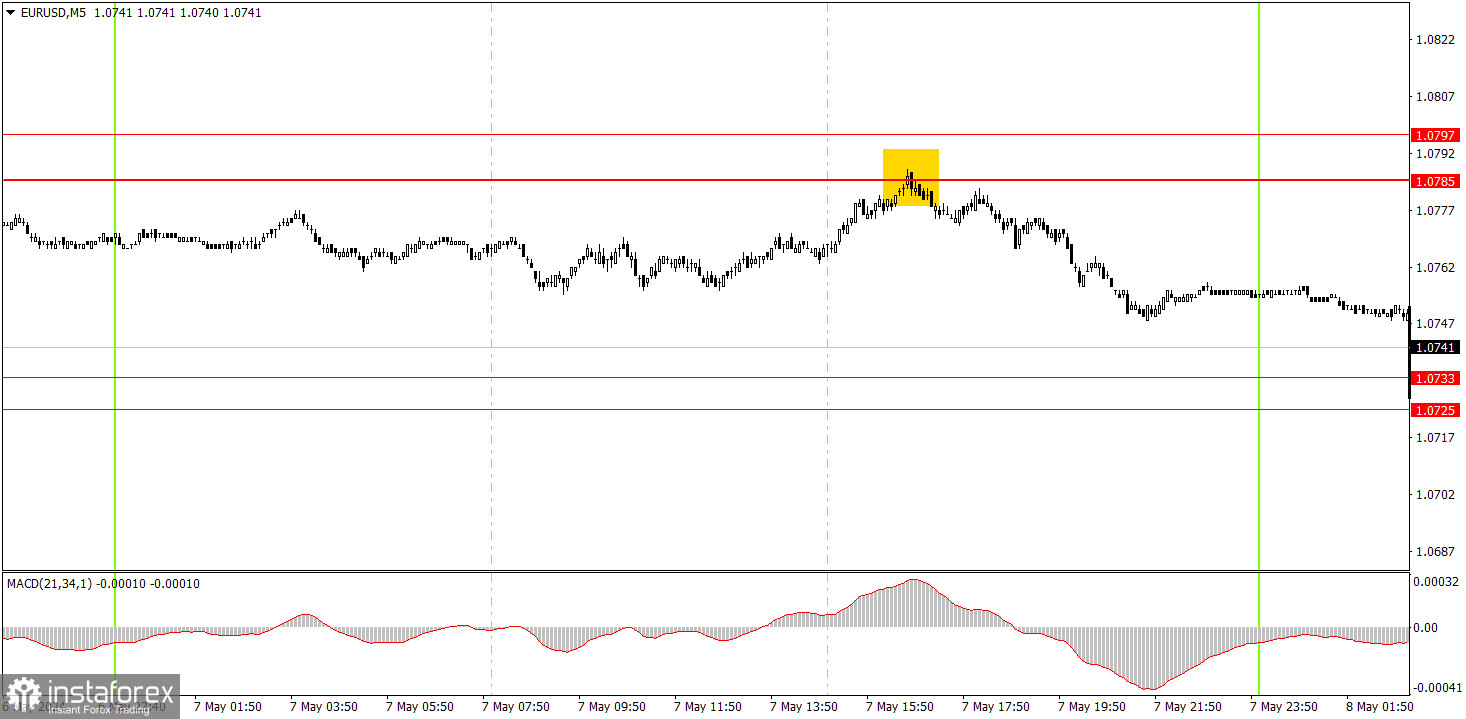
Only one trading signal was formed on the 5-minute timeframe. During the US trading session, the price bounced off the level of 1.0785, so novice traders could open short positions. The euro continues to fall, and it may continue to do so in the coming days. Therefore, investors can keep this trade open, at least until the price reaches the level of 1.0733. If it has already been closed, it still likely resulted in profit.
On the hourly chart, the EUR/USD pair is going through a corrective phase. We believe that the decline should resume in the medium term, as the euro remains relatively high, and in general, the global trend is pointed downwards. The fundamental background still works in favor of the US dollar, and the latest FOMC meeting supports this - now Federal Reserve Chair Jerome Powell doesn't even know when monetary policy easing will begin.
On Wednesday, it is reasonable to maintain short positions, as the price rebounded from the 1.0785-1.0797 area on Tuesday, and the uptrend has remained intact for way too long. Traders may consider selling the pair if the price consolidates below the channel and the 1.0725-1.0733 area.
The key levels on the 5M chart are 1.0483, 1.0526, 1.0568, 1.0611, 1.0678, 1.0725-1.0733, 1.0785-1.0797, 1.0838-1.0856, 1.0888-1.0896, 1.0940, 1.0971-1.0981. Today, the German industrial production report will be published, which has even less chance of a market reaction than yesterday's retail sales report. Therefore, we expect low volatility and weak movements.
1) Signal strength is determined by the time taken for its formation (either a bounce or level breach). A shorter formation time indicates a stronger signal.
2) If two or more trades around a certain level are initiated based on false signals, subsequent signals from that level should be disregarded.
3) In a flat market, any currency pair can produce multiple false signals or none at all. In any case, the flat trend is not the best condition for trading.
4) Trading activities are confined between the onset of the European session and mid-way through the U.S. session, after which all open trades should be manually closed.
5) On the 30-minute timeframe, trades based on MACD signals are only advisable amidst substantial volatility and an established trend, confirmed either by a trendline or trend channel.
6) If two levels lie closely together (ranging from 5 to 15 pips apart), they should be considered as a support or resistance zone.
Support and Resistance price levels can serve as targets when buying or selling. You can place Take Profit levels near them.
Red lines represent channels or trend lines, depicting the current market trend and indicating the preferable trading direction.
The MACD(14,22,3) indicator, encompassing both the histogram and signal line, acts as an auxiliary tool and can also be used as a signal source.
Significant speeches and reports (always noted in the news calendar) can profoundly influence the price dynamics. Hence, trading during their release calls for heightened caution. It may be reasonable to exit the market to prevent abrupt price reversals against the prevailing trend.
Beginning traders should always remember that not every trade will yield profit. Establishing a clear strategy coupled with sound money management is the cornerstone of sustained trading success.
*Analiza tržišta koja se ovde nalazi namenjena je boljem razumevanju tržišta i ne pruža instrukcije za vršenje trgovanja.
Uz InstaSpot-ove analitičke preglede uvek ćete biti u toku sa tržišnim trendovima! Klijentima InstaSpot-a su dostupni mnogobrojni besplatni servisi za uspešno trgovanje.


