


The legend in the InstaSpot team!
Legend! You think that's bombastic rhetoric? But how should we call a man, who became the first Asian to win the junior world chess championship at 18 and who became the first Indian Grandmaster at 19? That was the start of a hard path to the World Champion title for Viswanathan Anand, the man who became a part of history of chess forever. Now one more legend in the InstaSpot team!


Borussia is one of the most titled football clubs in Germany, which has repeatedly proved to fans: the spirit of competition and leadership will certainly lead to success. Trade in the same way that sports professionals play the game: confidently and actively. Keep a "pass" from Borussia FC and be in the lead with InstaSpot!

Trend-following analysis (picture 1)
This week, from the level of 1.0761 (the closing level of the last weekly candle), the instrument may begin a pullback movement downwards with a target of 1.0746, the Fibonacci level of 38.2% plotted by the red dotted line. When testing this level, the price may continue to move up with a target of 1.0835, the retracement level of 61.8% plotted by the red dotted line.
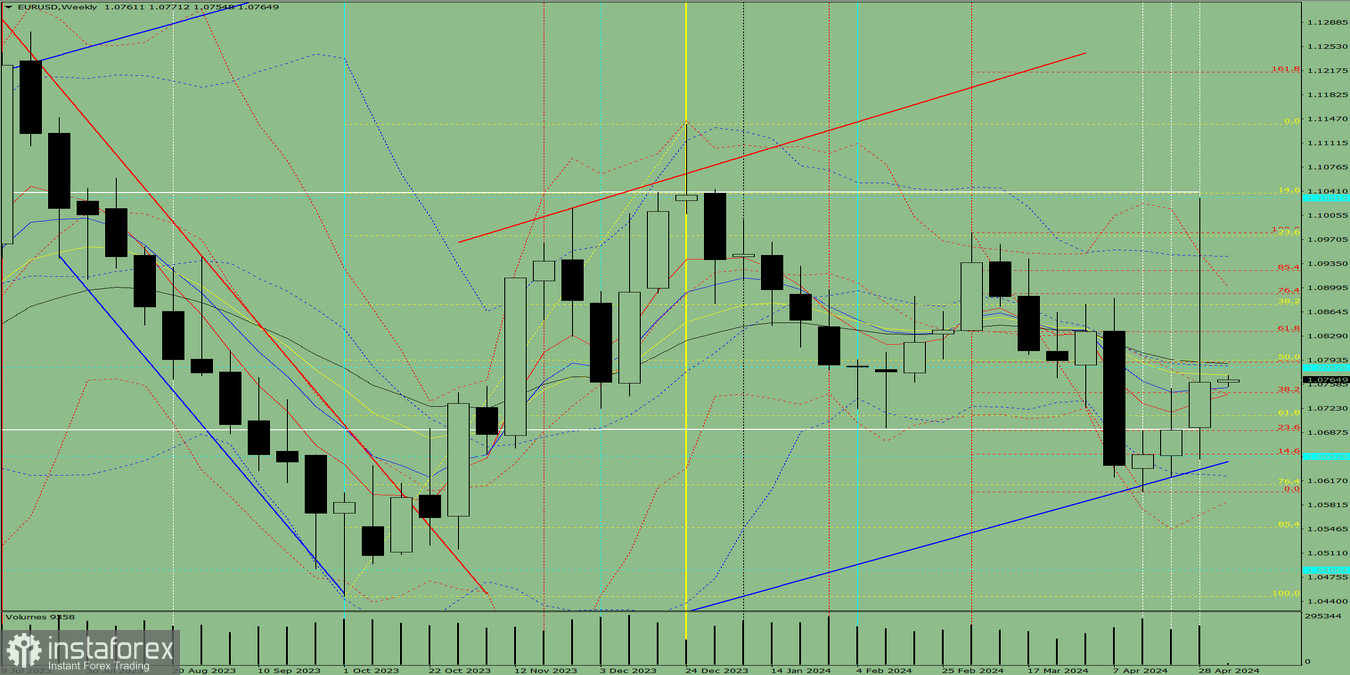
Picture 1: one-week chart
Complex analysis
Indicator analysis – up
Fibonacci levels – up
Trading volume – up
Candlestick analysis – down
Trend-following analysis – up
Bollinger bands – down
One-month chart – up
The conclusion from the complex analysis is an upward movement.
The result of evaluating the candlestick of the EUR/USD pair on the one-week chart: the price will most likely follow an upward trend during the week. This scenario is realistic due to the presence of the first lower shadow of the weekly white candle (Monday - down) and the absence of the second upper shadow (Friday - up).
This week, from 1.0761 (the close of the last weekly candle), EUR/USD may begin to move downward with a target of 1.0746, the retracement level of 38.2% plotted by the red dotted line. When testing this level, the price may continue to move up with a target of 1.0835, the retracement level of 61.8% plotted by the red dotted line.
An alternative scenario: from the level of 1.0761 (the closing level of the last weekly candle), the instrument can begin a pullback movement downwards with a target of 1.0712, the pullback level of 61.8% plotted by the yellow dotted line. When testing this level, the price may continue to move up with a target of 1.0835, the Fibonacci retracement level of 61.8% plotted by the red dotted line.
*Analiza tržišta koja se ovde nalazi namenjena je boljem razumevanju tržišta i ne pruža instrukcije za vršenje trgovanja.
Uz InstaSpot-ove analitičke preglede uvek ćete biti u toku sa tržišnim trendovima! Klijentima InstaSpot-a su dostupni mnogobrojni besplatni servisi za uspešno trgovanje.


