


Naš tim čini više od 7.000.000 trgovaca!
Svakog dana zajedno radimo na unapređenju trgovanja. Ostvarujemo vrhunske rezultate i krećemo se samo napred.
Priznatost od strane miliona trgovaca širom sveta najbolje pokazuje koliko se naš rad ceni! Napravili ste svoj izbor i mi ćemo učiniti sve što je neophodno da zadovoljimo vaša očekivanja!
Zajedno činimo sjajan tim!
InstaSpot. Sa ponosom radi za Vas!


Glumac, šampion UFC turnira i pravi heroj!
Čovek koji je ostvario sebe. Čovek koji hoda uz nas.
Tajna uspeha Taktarova jeste stalno kretanje ka svom cilju.
Otkrijte sve strane svog talenta!
Istražuj, pokušaj, padni - ali se nikad ne zaustavljaj!
InstaSpot. Priča Vašeg uspeha započinje ovde!

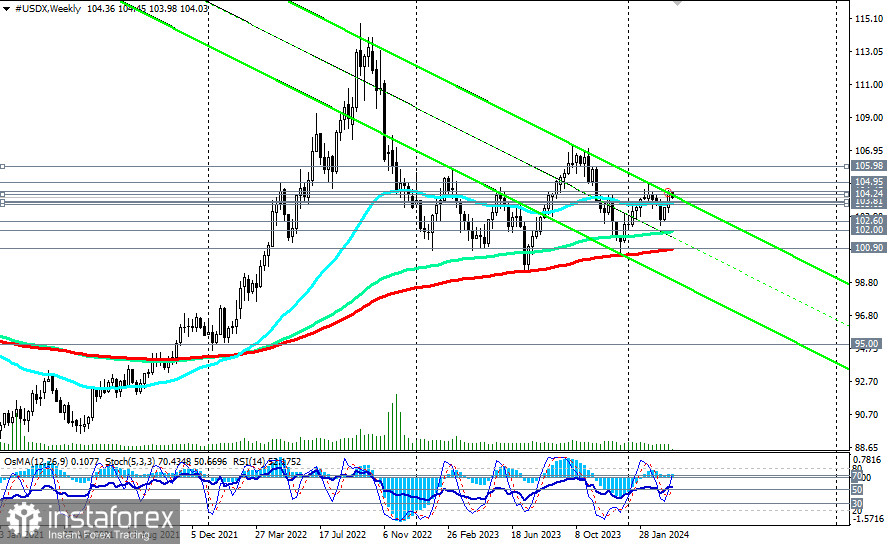
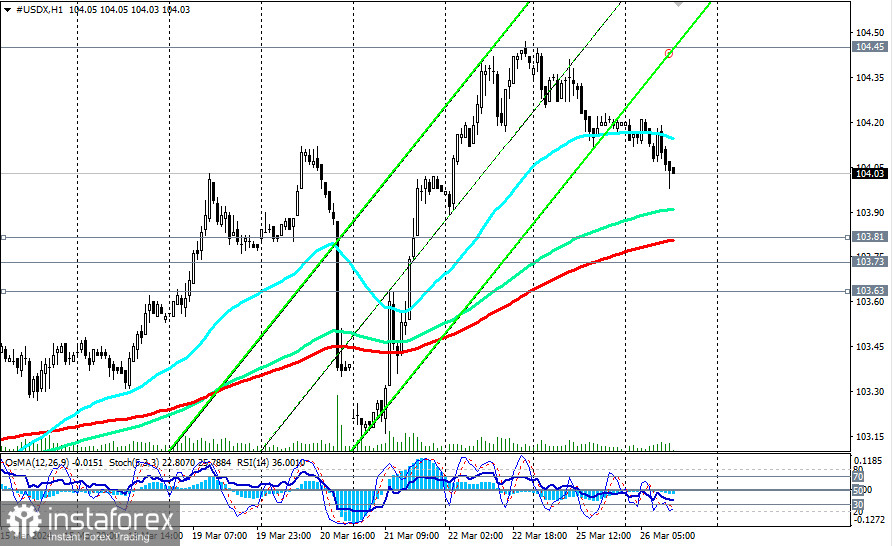
At the beginning of the week, the last in this month and quarter, the dollar is slightly losing its positions, declining for the second trading day from the local 4-week high of 104.20 reached last week.
Market and economists' expectations regarding the start of the Fed's monetary policy easing have shifted mainly to the second half of the year.
However, if inflation continues to accelerate and the U.S. economy and labor market demonstrate the same resilience, the start of the Fed's monetary policy easing cycle may be pushed even further into the future, perhaps even to the next year. This, in turn, will provide support to the dollar.
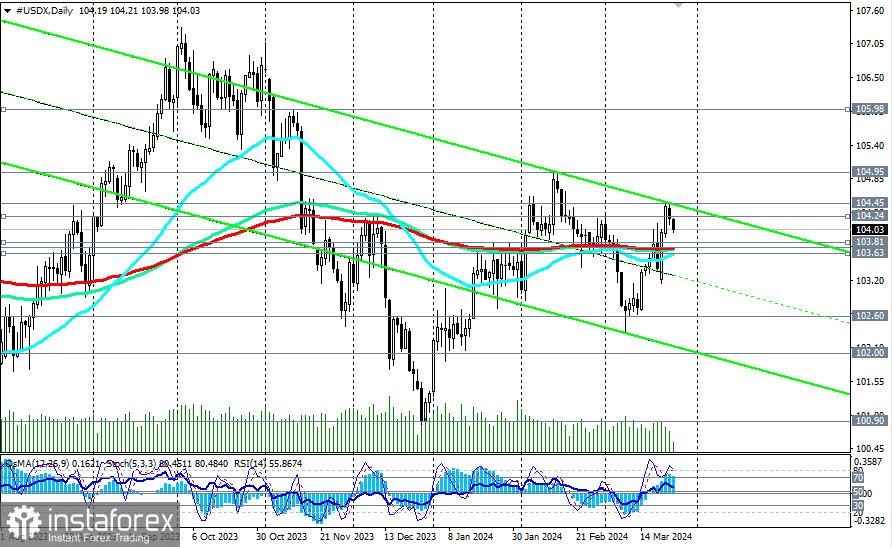
As of writing, the dollar index (CFD #USDX in the MT4 terminal) was trading near the 104.00 mark, declining towards the support zone around the levels of 103.81 (200 EMA on the 1-hour chart), 103.73 (200 EMA on the daily chart), 103.63 (200 EMA on the 4-hour chart).
If today's macroeconomic statistics from the U.S. at the beginning of the American trading session turn out to be weak, then we should expect the above-mentioned support levels to be reached.
In turn, their breakdown may signal an increase in short positions with targets at key support levels of 102.00 (144 EMA on the weekly chart), 100.90 (200 EMA on the weekly chart), 100.00, still separating the long-term bullish market from the bearish one and making long-term long positions preferable.
In an alternative scenario, the first signal for new purchases here may be the breakout of the local resistance level of 104.24, and the breakout of the local resistance level of 104.45 (upper boundary of the downward channel on the weekly chart) will confirm this.
Here, the growth target may be the local resistance level of 104.95 and the level of 105.00.
Support levels: 104.00, 103.81, 103.73, 103.63, 103.00, 102.60, 102.30, 102.00, 101.90, 101.00, 100.90, 100.00
Resistance levels: 104.24, 104.45, 104.95, 105.00, 106.00, 106.80, 107.00, 107.30
Trading Scenarios
Alternative scenario: Buy Stop 104.30. Stop-Loss 103.90. Targets 104.45, 104.95, 105.00, 106.00, 106.80, 107.00, 107.30
Main scenario: Sell Stop 103.90. Stop-Loss 104.30. Targets 103.81, 103.73, 103.63, 103.00, 102.60, 102.30, 102.00, 101.90, 101.00, 100.90, 100.00
"Targets" correspond to support/resistance levels. This also does not mean that they will necessarily be reached, but they can serve as a guide when planning and placing your trading positions.
*Analiza tržišta koja se ovde nalazi namenjena je boljem razumevanju tržišta i ne pruža instrukcije za vršenje trgovanja.
Uz InstaSpot-ove analitičke preglede uvek ćete biti u toku sa tržišnim trendovima! Klijentima InstaSpot-a su dostupni mnogobrojni besplatni servisi za uspešno trgovanje.


