


Naš tim čini više od 7.000.000 trgovaca!
Svakog dana zajedno radimo na unapređenju trgovanja. Ostvarujemo vrhunske rezultate i krećemo se samo napred.
Priznatost od strane miliona trgovaca širom sveta najbolje pokazuje koliko se naš rad ceni! Napravili ste svoj izbor i mi ćemo učiniti sve što je neophodno da zadovoljimo vaša očekivanja!
Zajedno činimo sjajan tim!
InstaSpot. Sa ponosom radi za Vas!


Glumac, šampion UFC turnira i pravi heroj!
Čovek koji je ostvario sebe. Čovek koji hoda uz nas.
Tajna uspeha Taktarova jeste stalno kretanje ka svom cilju.
Otkrijte sve strane svog talenta!
Istražuj, pokušaj, padni - ali se nikad ne zaustavljaj!
InstaSpot. Priča Vašeg uspeha započinje ovde!

Trend analysis (Fig. 1).
The GBP/USD currency pair may move downward from the level of 1.2724 (closing of yesterday's daily candle) to test the 1.2692 support level (blue thick line). Upon reaching this level, an upward movement is possible to test the historical resistance level of 1.2733 (blue dotted line).
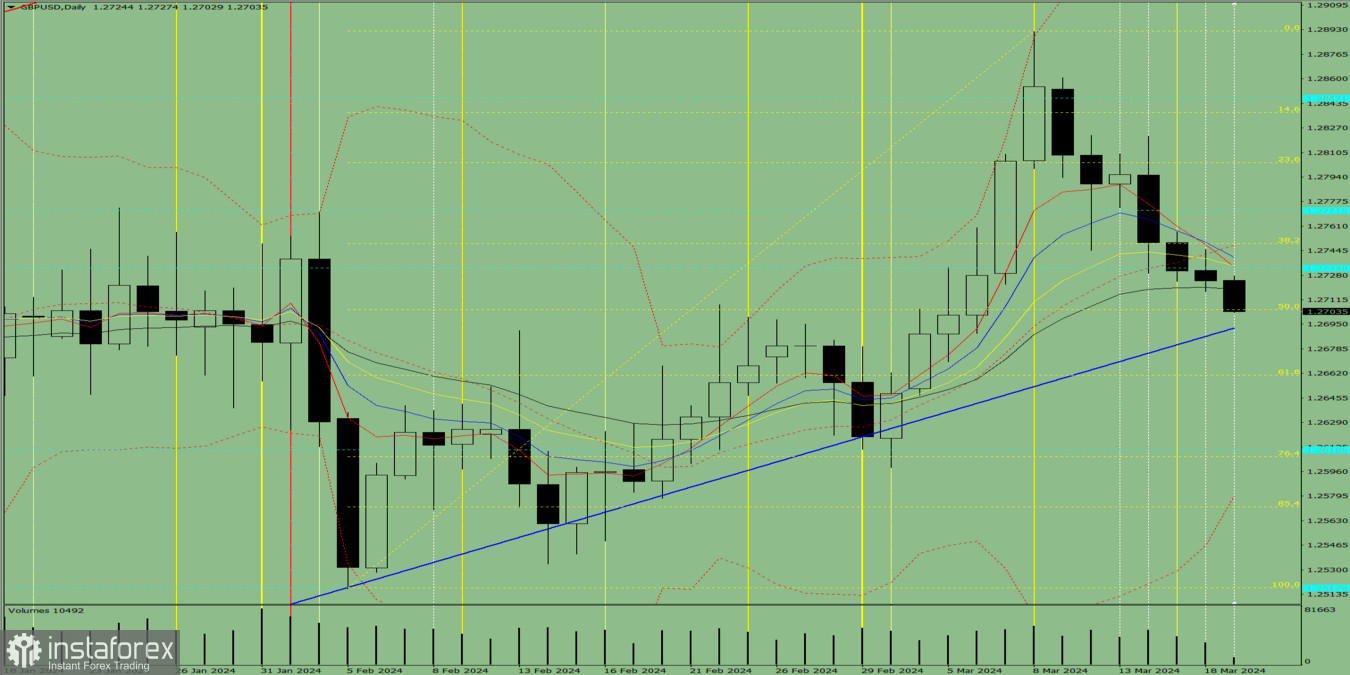
Fig. 1 (daily chart).
Comprehensive analysis:
General conclusion: Today, the price may move downward from the level of 1.2724 (closing of yesterday's daily candle) to test the 1.2692 support level (blue thick line). Upon reaching this level, an upward movement is possible to test the historical resistance level of 1.2733 (blue dotted line).
Alternatively, from the level of 1.2724 (closing of yesterday's daily candle), the price may move downward to test the 61.8% pullback level at 1.2661 (yellow dotted line). Upon reaching this level, an upward movement is possible with the target of testing the historical resistance level of 1.2733 (blue dotted line).
*Analiza tržišta koja se ovde nalazi namenjena je boljem razumevanju tržišta i ne pruža instrukcije za vršenje trgovanja.
Uz InstaSpot-ove analitičke preglede uvek ćete biti u toku sa tržišnim trendovima! Klijentima InstaSpot-a su dostupni mnogobrojni besplatni servisi za uspešno trgovanje.


