


Naš tim čini više od 7.000.000 trgovaca!
Svakog dana zajedno radimo na unapređenju trgovanja. Ostvarujemo vrhunske rezultate i krećemo se samo napred.
Priznatost od strane miliona trgovaca širom sveta najbolje pokazuje koliko se naš rad ceni! Napravili ste svoj izbor i mi ćemo učiniti sve što je neophodno da zadovoljimo vaša očekivanja!
Zajedno činimo sjajan tim!
InstaSpot. Sa ponosom radi za Vas!


Glumac, šampion UFC turnira i pravi heroj!
Čovek koji je ostvario sebe. Čovek koji hoda uz nas.
Tajna uspeha Taktarova jeste stalno kretanje ka svom cilju.
Otkrijte sve strane svog talenta!
Istražuj, pokušaj, padni - ali se nikad ne zaustavljaj!
InstaSpot. Priča Vašeg uspeha započinje ovde!

The United States Department of Labor report grabbed investors' attention on Friday, which unexpectedly reflected an intensification of "overheating" in the labor market. Firstly, the job growth (353,000) was nearly double the consensus forecast (180,000) and marked the highest in the past year. Additionally, December data was revised upward from 216,000 to 333,000. These figures significantly exceed the expected 70–100,000 per month, which Federal Reserve Chairman Jerome Powell considers proportional to the increase in the working-age population.
Secondly, the unemployment rate remained at 3.7% for the third consecutive month, surpassing the market expectation of an increase to 3.8%. Thirdly, the growth in average hourly wages unexpectedly accelerated from 0.4% month-on-month in December to 0.6% (the highest since March 2022), while a slowdown to 0.3% was anticipated. On a yearly basis, wage growth accelerated from 4.1% to 4.5% (the highest since September of the previous year). According to experts, the wage growth rate corresponding to the 2% inflation target of the Federal Reserve is in the range of 3.0–3.5% year-on-year. The only weak indicator in the report was the reduction in the average workweek duration.
Based on this data, the U.S. dollar sharply strengthened.

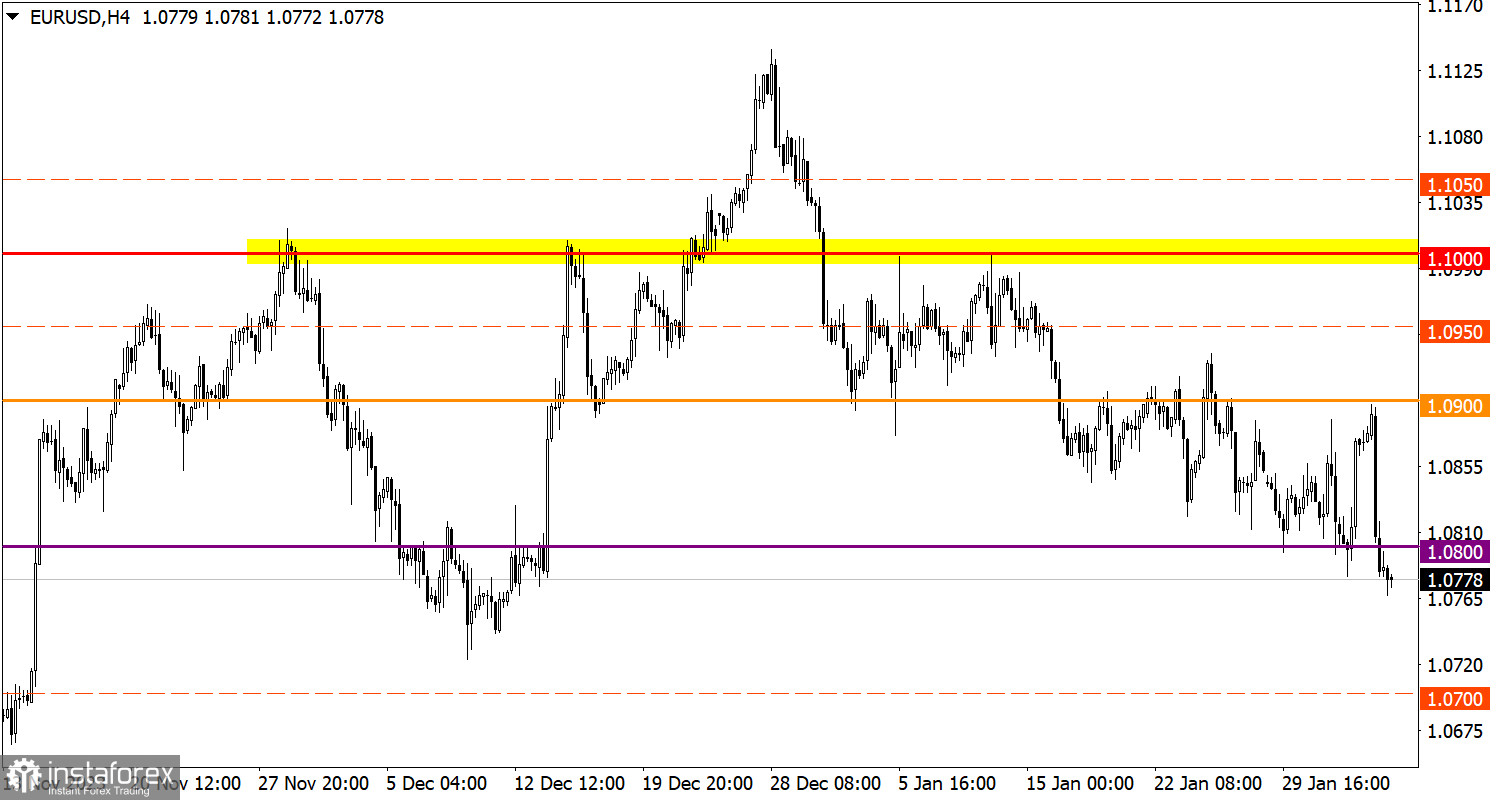
As a result of active speculation, EUR/USD broke below the support level of 1.0800, leading to a continuation of the current downward cycle in the market. This trend is accompanied by an increase in the volume of short positions on the euro.
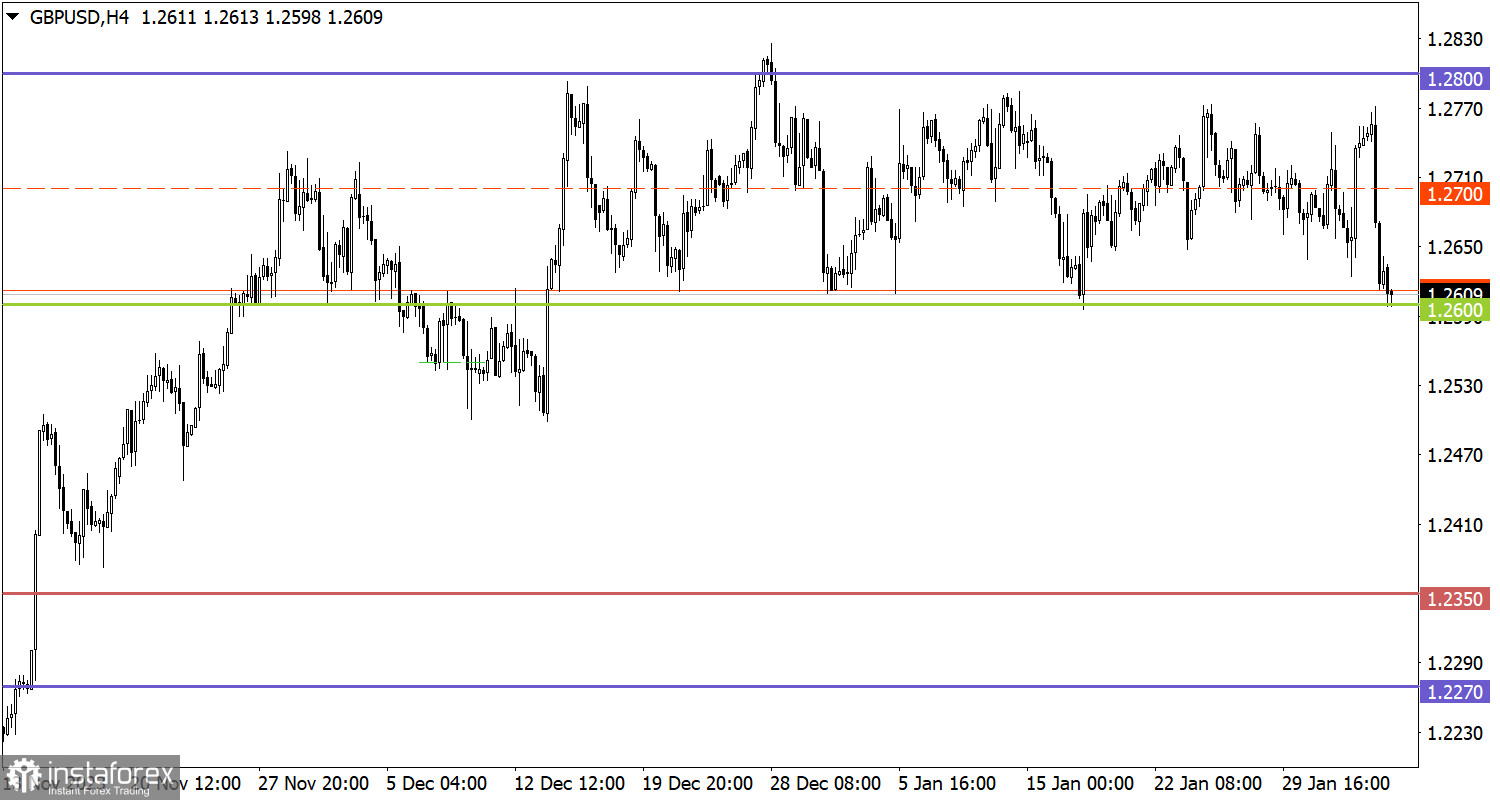
Synchronously with the overall market movement, the GBP/USD currency pair also headed downward, causing a depreciation of the pound sterling by more than 1%, which is about 150 points. Despite significant price fluctuations, no radical changes occurred, and the quote remains within the range of the sideways channel 1.2600/1.2800, which has persisted for several weeks.
Today, the dollar is likely to continue strengthening its position in the market. The decline in producer prices in the European Union is expected to accelerate from -8.8% to -10.2%. This significant decline in producer prices indicates growing deflation risks in the European economy. Despite recent high inflation in Europe, prompting the European Central Bank (ECB) to pursue a strict monetary policy, inflation is now declining, and the producer price index suggests the possibility of deflation.
The ECB will inevitably have to start easing its monetary policy. Thus, a situation arises where by the time the Federal Reserve starts lowering interest rates, the ECB will have already taken several similar steps. The level of interest rates in Europe is already lower than in the United States.
It is also worth noting that Fed Chair Powell expressed concerns about lowering interest rates, citing conflicting macroeconomic data in his weekend interview. This gives the U.S. dollar a certain advantage in the market.
Steady price retention below 1.0800 increases the probability of further euro depreciation. However, note that technical signs of oversold conditions are already observed in the short term, which may have a negative impact on the volume of short positions.
Based on the theory of trading within the channel, touching the lower boundary of 1.2600 may negatively impact the volume of short positions on the pound sterling. In this case, a price rebound towards the average level of 1.2700 is possible. However, if the price stabilizes below the 1.2600 boundary during the day, a break in the sideways channel may occur, leading to subsequent movement towards a breakthrough.
The candlestick chart type is white and black graphic rectangles with lines above and below. With a detailed analysis of each individual candle, you can see its characteristics relative to a particular time frame: opening price, closing price, intraday high and low.
Horizontal levels are price coordinates, relative to which a price may stop or reverse its trajectory. In the market, these levels are called support and resistance.
Circles and rectangles are highlighted examples where the price reversed in history. This color highlighting indicates horizontal lines that may put pressure on the asset's price in the future.
The up/down arrows are landmarks of the possible price direction in the future.
*Analiza tržišta koja se ovde nalazi namenjena je boljem razumevanju tržišta i ne pruža instrukcije za vršenje trgovanja.
Uz InstaSpot-ove analitičke preglede uvek ćete biti u toku sa tržišnim trendovima! Klijentima InstaSpot-a su dostupni mnogobrojni besplatni servisi za uspešno trgovanje.


