After two weeks of stagnation, Bitcoin has nevertheless begun to fall, though at the moment the decline can be described as fairly weak but potentially significant. A correction has begun, and it may take quite a long time. Recall that there is a non-negligible probability that the downtrend will end. However, the reasons for a new "bull" trend remain ambiguous and debatable. The last rise in Bitcoin, which lasted three months, was essentially a move from the lower boundary of the sideways channel to the upper boundary on the daily timeframe after a deviation formed at the channel's lower edge and then at the upper edge. The deviation at the upper boundary was deep, but if it truly was a deviation, then Bitcoin will head toward $70,800 in the near term. After that, the price will again sit inside the flat, and its prospects will remain uncertain.
Next week the Federal Reserve will hold the penultimate meeting of the year, and the U.S. central bank's stance is already known. Even if the key rate is not raised (the base scenario), the Fed will in any case maintain a hawkish tone because inflation in the U.S. continues to rise. Thus, the Fed's hawkish monetary-policy outlook is unlikely to support further gains in the leading cryptocurrency, which effectively remains in a sideways channel on the daily timeframe and in a downtrend on the weekly timeframe.
Also note that U.S. midterm congressional elections will be held on November 3. With roughly 99% probability, Republicans will lose power in at least one chamber, after which passing the Clarity Act will become even harder. Some Republicans oppose Trump's bill, believing it serves only the president's personal enrichment. Also recall that traditionally Bitcoin falls after the midterm elections — this pattern has been observed for 12 years. Since a move is unlikely to begin immediately after the vote, a decline can be expected already now. Moreover, the daily chart points to a downward direction.
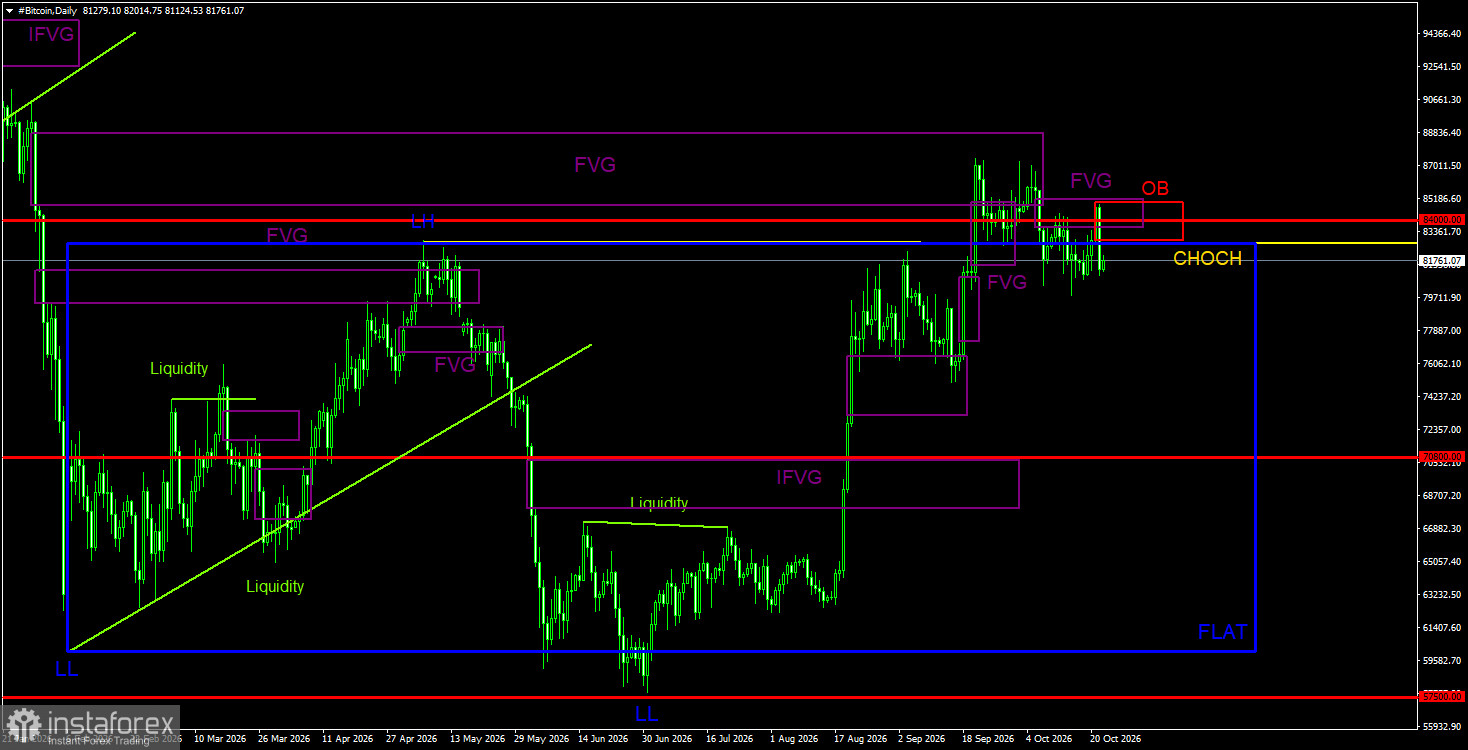
On the daily timeframe, the downward trend structure is broken, so most likely "digital gold" has officially moved into forming a new bullish trend. The price worked off the bearish FVG from the previous trend, reacted to that pattern, and a correction began as expected. However, the September breakout beyond the $60,000–$82,500 sideways channel may still be a deviation which, together with the reaction to the bearish FVG, could provoke a drop to the lower boundary of the sideways channel. Another sell signal formed inside the last bearish FVG. In addition, a bearish order block has formed, which also points downward and could lead to another sell signal.
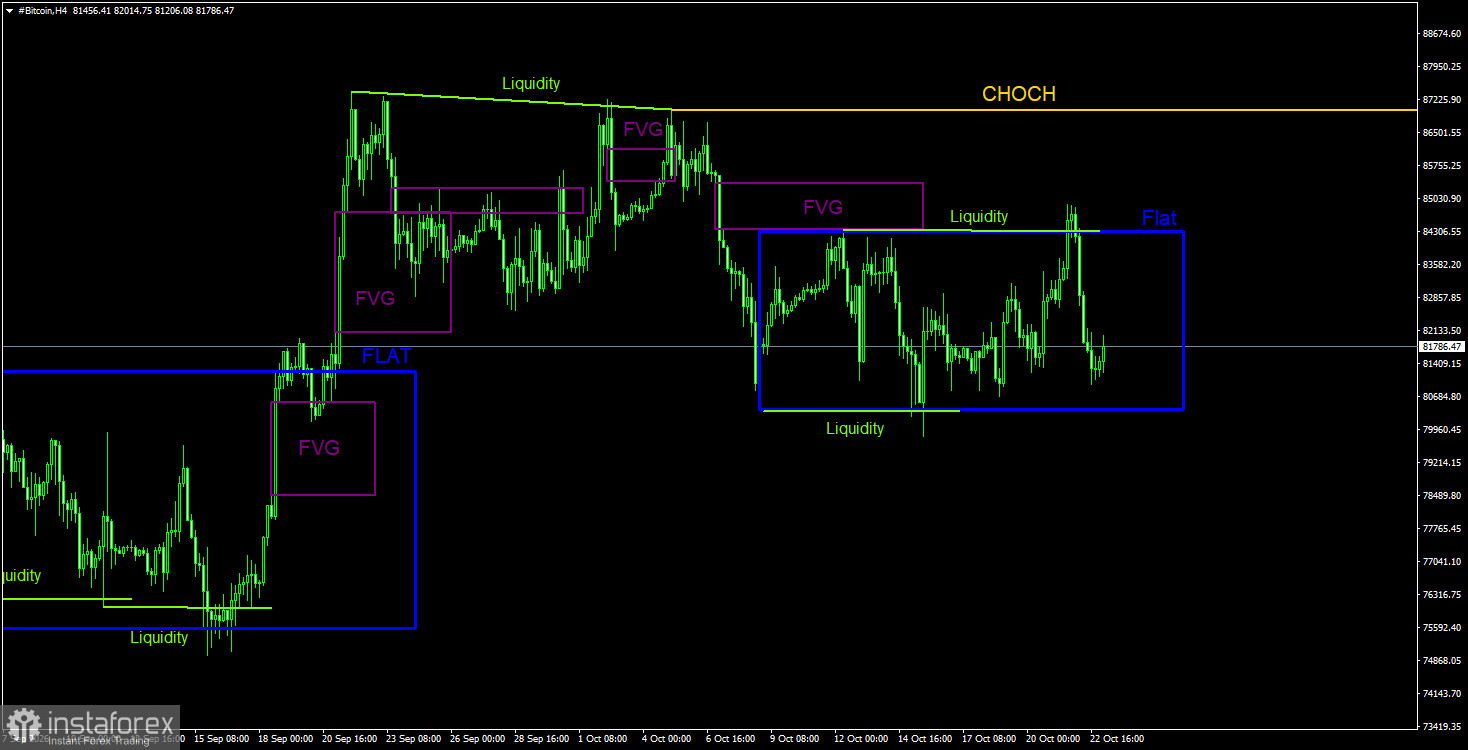
On the 4-hour timeframe, a downward structure began to form. The CHOCH line is currently at the $87,000 level. On the daily TF, all necessary reversal signals to the downside were received, allowing traders to open short positions. Bitcoin's targets are best determined by the daily sideways channel, which we regard as still relevant. On the 4-hour TF, a flat formed, followed by an upper-boundary deviation of the sideways channel, which we warned about in advance. Thus, predictably, Bitcoin dropped to the lower boundary of the local sideways channel. Given the number of bearish patterns and sell signals, we would expect an exit from the sideways channel via the lower boundary and further decline of the leading cryptocurrency.
Bitcoin shows signs of the start of a new bullish trend. This trend began, as is typical, with a pump that has no specific clear reasons. The Fed has not started cutting rates, and the Clarity Act bill was not passed. However, in the near term on the daily TF, Bitcoin may be in decline because the price reacted to the bearish FVG and formed two sell signals. Also note that a breakout beyond the daily sideways channel may be a deviation — yes, a deep deviation, but still a deviation. If so, Bitcoin could head toward $70,800 and even maintain the downtrend that began last year. We believe short positions are most relevant in the near term. Two sell signals with deviation formed on the daily TF, and a deviation formed on the 4-hour TF. Bitcoin's prospects remain bearish—nearest targets: $80,400 and $70,800. A deviation near the lower boundary of the sideways channel on the 4-hour TF will likely leave Bitcoin flat for some time.
CHOCH — Change of Character: a break in trend structure.
Liquidity — Liquidity: stop-losses and pending orders that market-makers use to accumulate positions.
FVG — Fair-Value Gap: a price-inefficiency zone. Price moves quickly through such areas, indicating one side is absent from the market. Subsequently, price often returns and reacts to these areas, continuing the main trend.
IFVG — Inverted Fair-Value Gap: after returning to such a zone, price does not react there but impulsively breaks through it and then tests it from the other side.
OB — Order Block: a candle where a market-maker opened a position with the intent to take liquidity and then establish a position in the opposite direction.
*A análise de mercado aqui postada destina-se a aumentar o seu conhecimento, mas não dar instruções para fazer uma negociação.
InstaSpot analytical reviews will make you fully aware of market trends! Being an InstaSpot client, you are provided with a large number of free services for efficient trading.