




Nossa equipe tem mais de 7,000,000 traders!
Todos os dias, trabalhamos juntos para melhorar a negociação. Obtivemos resultados elevados e avançamos.
O reconhecimento de milhões de traders em todo o mundo é a melhor apreciação do nosso trabalho! Você nos escolheu e faremos tudo o que for necessário para atender às suas expectativas!
Nós somos uma ótima equipe juntos!
InstaSpot. Orgulho de trabalhar para você!





Ator, hexacampeão do UFC e um verdadeiro herói!
Um homem de sucesso. Um homem que mostra o nosso caminho.
O segredo por trás do sucesso de Taktarov é um movimento constante em direção ao objetivo.
Revele todos os lados do seu talento!
Descubra, tente, falhe, mas nunca pare!
I InstaSpot. Sua história de sucesso começa aqui!
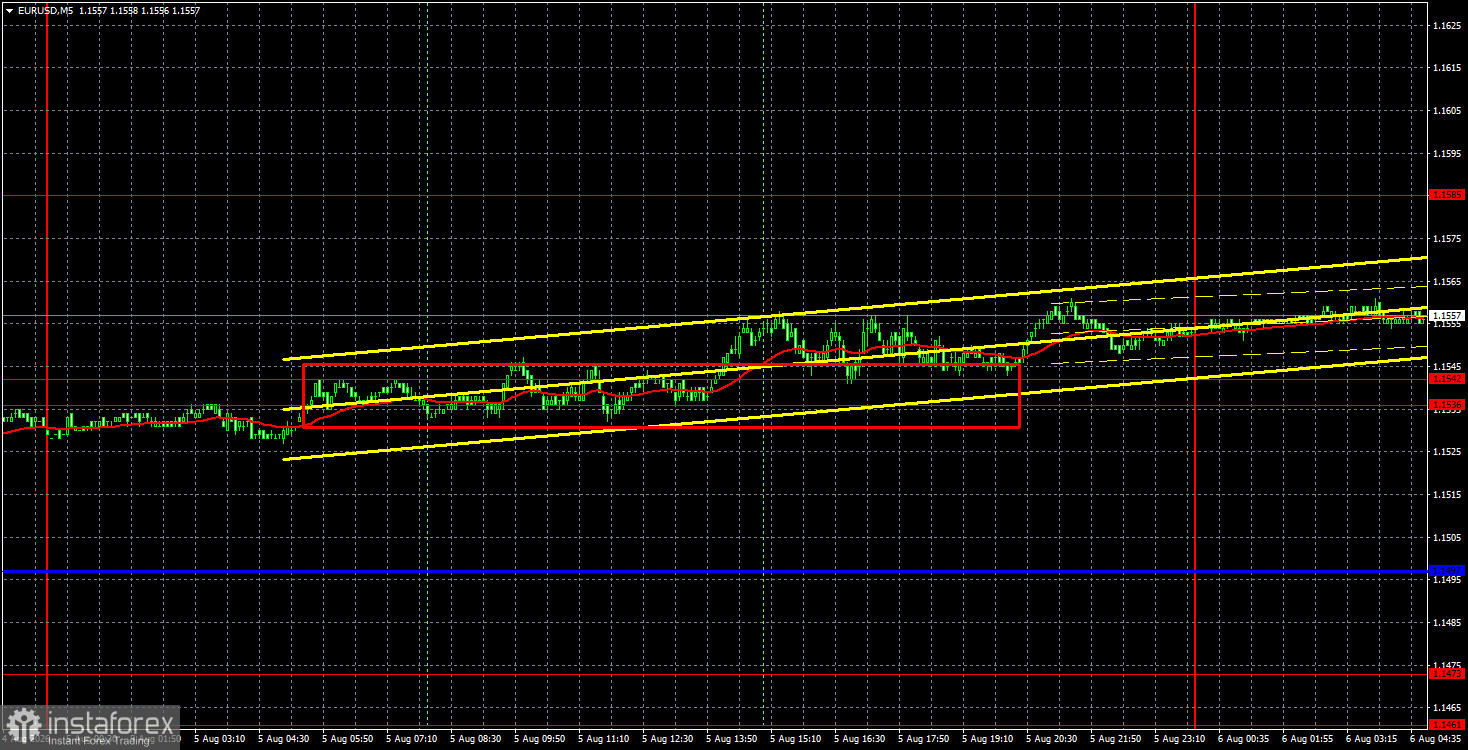
On Wednesday, August 5, the EUR/USD currency pair continued its steady upward movement and consolidated above the 1.1536–1.1542 area. Thus, as we anticipated, the rise of the European currency continues. And this is not even about macroeconomic data or the geopolitical situation in the Middle East. The point is that the euro was undervalued after the first half of 2026. The market completely ignored the European Central Bank's monetary tightening two months ago, while readily pricing in a Federal Reserve rate hike that has not even occurred. Technicals are also on the euro's side, since despite the dollar improving its position in 2026, it has not shown any meaningful gains on the weekly TF. The long-term uptrend remains, so we still expect only appreciation of the pair. As for yesterday, both U.S. reports did not support the dollar. The ADP report was twice as weak as forecasts, and the ISM services PMI also missed trader expectations. Therefore, this week only the ISM manufacturing index supported the dollar on Monday.
Technically, the pair left the 1.1362–1.1461 sideways channel after a month of pain. Traders can now expect not just an upward tendency but a full-fledged trend. Recall that over the past year the EUR/USD pair has moved mostly sideways, and there remain no strong grounds for a long-term dollar trend.
On the 5-minute TF on Wednesday, exactly one trading signal was formed. Between 10:00 and 12:00, the pair tried hard to crawl above the 1.1536–1.1542 area, ultimately succeeding. Thus, a buy signal was formed, allowing traders to trade. The long position should have been carried into Thursday, as market volatility is again low.
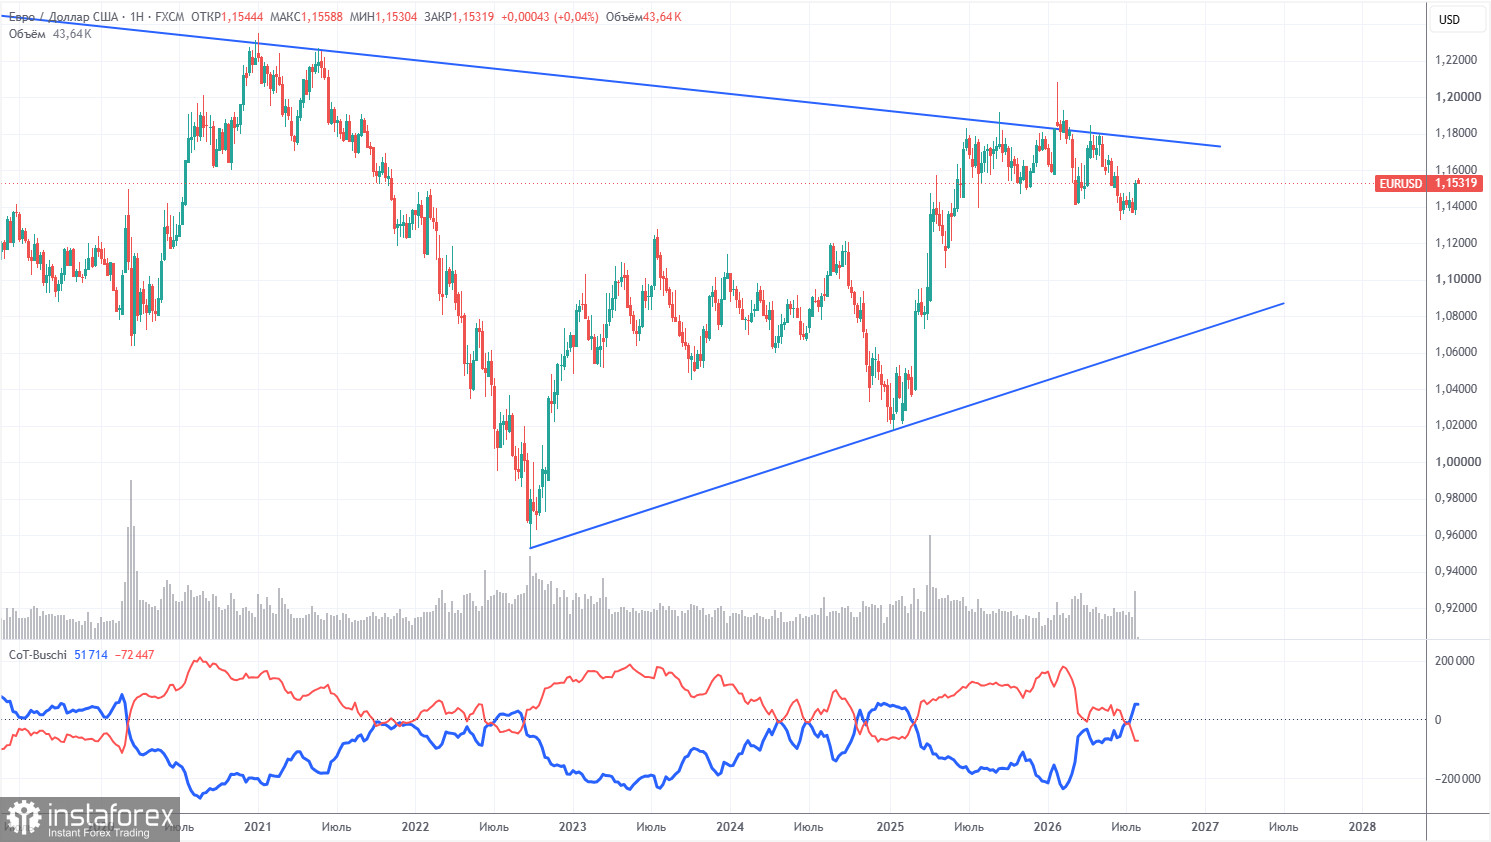
The latest COT report is dated July 28. In the weekly TF illustration, it is clear that the net position of non-commercial traders has turned "bearish" and has fallen substantially in 2026 due to geopolitical events. Traders have been disposing of the euro in favor of the U.S. dollar in recent months. Donald Trump's policy has not changed, but for a time the dollar acted as a "reserve currency."
We still do not see any fundamental factors for strengthening the euro, whereas there remain enough factors for the U.S. dollar to weaken. The Middle East war temporarily made the dollar super-attractive, but when that factor's "expiry date" comes, everything will revert. In the long term, the euro could fall to as low as $1.08 (trend line), but the uptrend will remain relevant. Over the recent months of dollar strength, the pair has not approached that line much.
The position of the red and blue indicator lines indicates parity between bulls and bears. During the last reporting week, the number of longs in the "Non-commercial" group decreased by 15,500, while shorts increased by 15,600. Accordingly, the net position decreased by 31,100 contracts over the week.
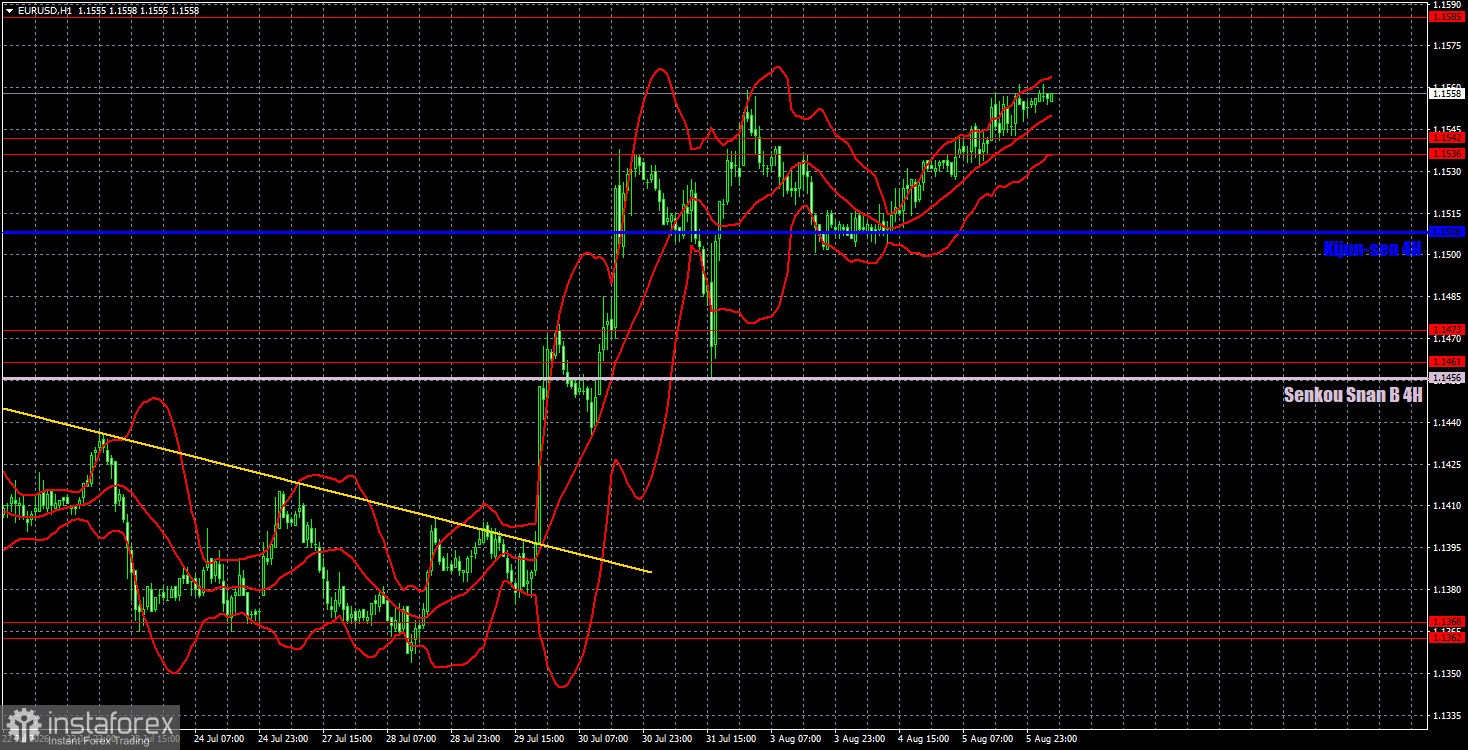
On the hourly TF, the pair began a new upward tendency after a month-long pause. The situation in the Middle East remains tense and has not improved, but that is no longer sufficient for a new, powerful rise in the dollar. In recent months, the market ignored all positives for the euro and focused only on Fed monetary policy, inflating expectations. If the situation has changed now, the euro has the opportunity to price in past news/events/reports that the market previously ignored.
For August 6 we highlight the following levels for trading — 1.1234, 1.1274, 1.1362–1.1368, 1.1461–1.1473, 1.1536–1.1542, 1.1585, 1.1657–1.1666, 1.1750–1.1760, 1.1786, 1.1830–1.1837, and also the Ichimoku Senkou Span B line (1.1456) and Kijun-sen (1.1508). The Ichimoku lines may move during the day and should be taken into account when determining signals. Don't forget to move the stop loss to breakeven if the price moves 15 pips in the favorable direction. This will protect against potential losses if the signal proves false.
On Thursday, the macroeconomic background will be very weak. In the EU, the retail sales report will be published, and in the U.S., the jobless claims report will be published. Both reports can confidently be considered secondary and unlikely to provoke a market reaction.
Today, traders may open short positions with targets at 1.1508 and 1.1461–1.1473 if the price consolidates below the 1.1536–1.1542 area. Consolidation above the 1.1536–1.1542 area allowed opening long positions yesterday with targets of 1.1585 and 1.1657–1.1666.
*A análise de mercado aqui postada destina-se a aumentar o seu conhecimento, mas não dar instruções para fazer uma negociação.
InstaSpot analytical reviews will make you fully aware of market trends! Being an InstaSpot client, you are provided with a large number of free services for efficient trading.


