




A lenda da equipe InstaSpot!
Lenda! Você acha que isso é retórica bombástica? Mas como devemos chamar um homem que se tornou o primeiro asiático a vencer o campeonato mundial de xadrez aos 18 anos e que se tornou o primeiro grande mestre indiano aos 19? Esse foi o começo de um caminho difícil para o título de campeão do mundo para Viswanathan Anand, o homem que se tornou parte da história do xadrez para sempre. Agora mais uma lenda na equipe InstaSpot!





O Borussia é um dos clubes de futebol com mais títulos da Alemanha, que provou repetidamente aos fãs: o espírito de competição e liderança certamente levará ao sucesso. Negocie da mesma maneira que os profissionais do esporte jogam: com confiança e ativamente. Mantenha o "ritmo" do Borussia FC e esteja na liderança com a InstaSpot!
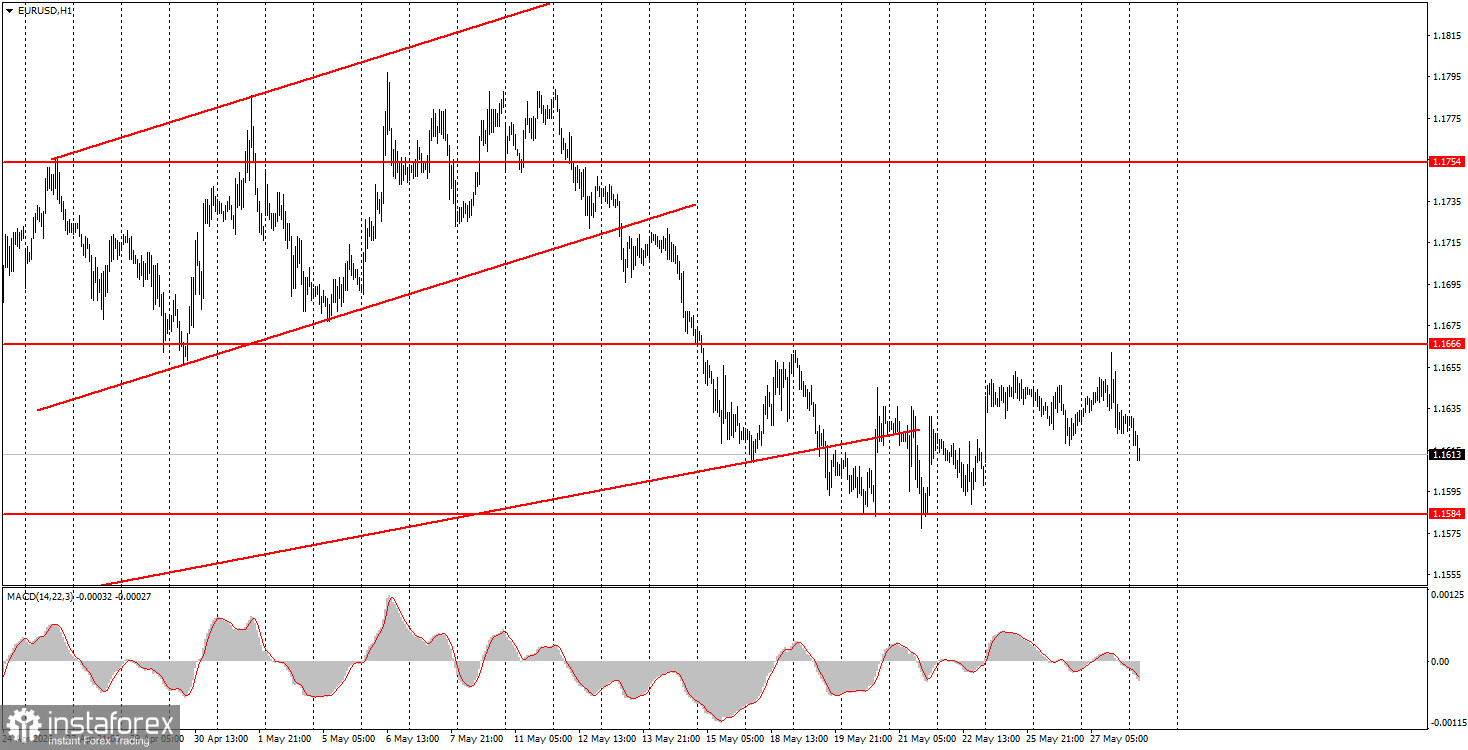
The EUR/USD currency pair traded again on Wednesday with low volatility, mostly sideways, with no macroeconomic or fundamental backdrop. There were no geopolitical events throughout the day. Thus, the almost complete immobilization of the currency pair is easily explained. After a 200-pip drop, the euro has not recovered and has been trading between 1.1584 and 1.1666 for more than a week. Therefore, low volatility and lack of movement are further compounded by a flat market. The U.S. dollar has no strong reasons for further growth, as despite a number of unpleasant statements from Iran this week and the breach of the ceasefire on Tuesday in the Strait of Hormuz, negotiations are ongoing, and Donald Trump still hopes to sign a memorandum. However, when that will happen, given all the circumstances, is unknown. Thus, the market is simply waiting.
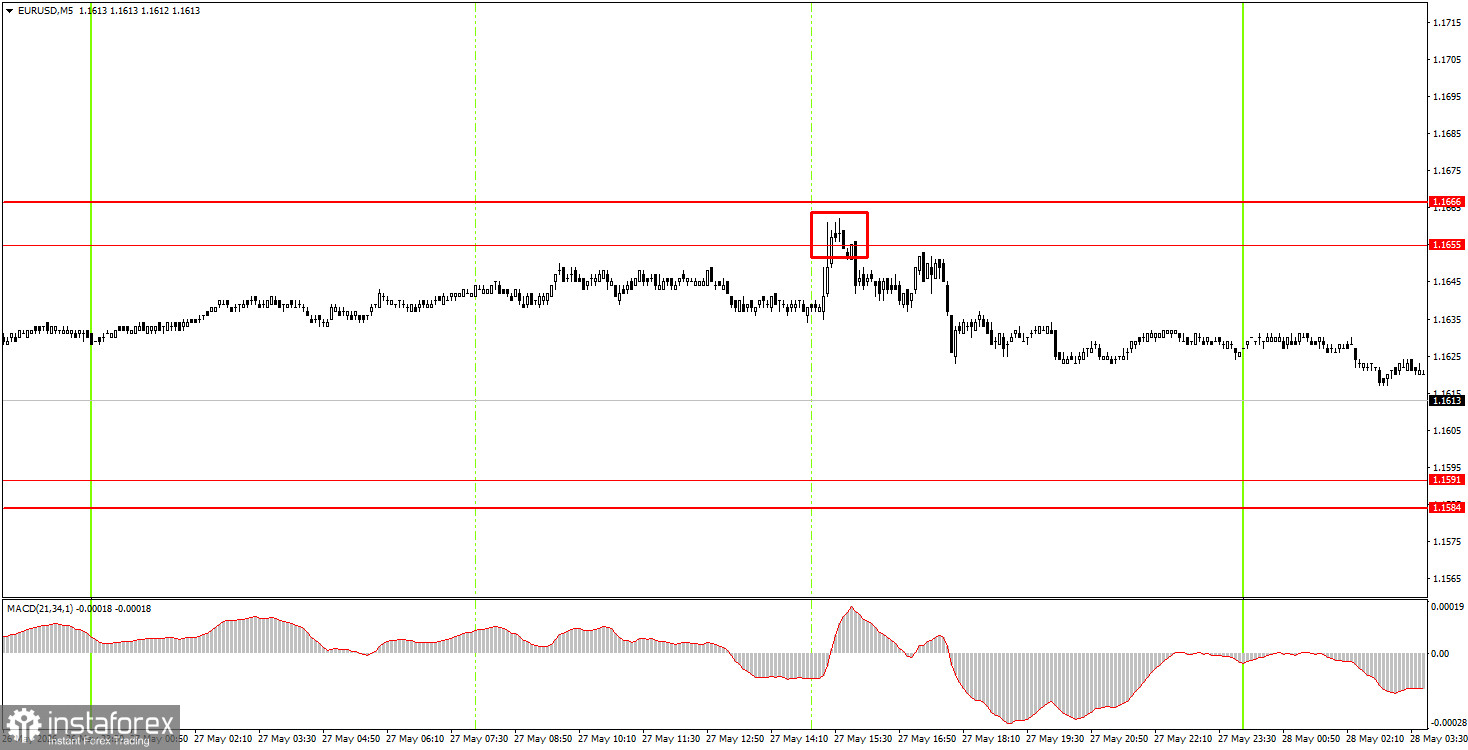
In the 5-minute timeframe on Wednesday, exactly one sell trade signal was generated. Moreover, it was quite good. At the beginning of the American trading session, the pair bounced from the area of 1.1655-1.1666, which can be considered the upper boundary of the flat, and fell about 15 pips by the end of the day. Since it is currently a flat market, the decline may continue today towards the area of 1.1584-1.1591.
On the hourly timeframe, the euro has been in correction for a whole month. The growth of the American currency has resumed, as the conflict in the Middle East was on the brink of escalation last week, but we still do not expect a prolonged rise in the American currency. The market continues to mostly ignore fundamentals and macroeconomics, while geopolitics swings the EUR/USD pair up and down.
On Thursday, novice traders may remain in short positions with a target of 1.1584-1.1591, as the price bounced from the area of 1.1655-1.1666 as early as Monday, and then again on Wednesday. New long positions can be considered if the price bounces from the area of 1.1584-1.1591, with a target of 1.1655-1.1666.
On the 5-minute timeframe, levels to consider are 1.1354-1.1363, 1.1413, 1.1455-1.1474, 1.1527-1.1531, 1.1584-1.1591, 1.1655-1.1666, 1.1745-1.1754, 1.1830-1.1837, and 1.1899-1.1908. On Thursday, Christine Lagarde will give a speech in the European Union, and in the U.S., reports on durable goods orders, personal income, and consumer spending, as well as the PCE index, will be released. A slight reaction to this data may follow, but it is unlikely to lead to the end of the flat market.
Price levels (areas) of support and resistance – levels that are targets when opening purchases or sales, or sources of signals.
Red lines – channels or trend lines that display the current trend and indicate which direction is preferable to trade now.
MACD indicator (14, 22, 3) – histogram and signal line – a supporting indicator that can also be used as a source of signals.
Important speeches and reports (contained in the news calendar) can significantly influence the movement of the currency pair. Therefore, during their release, trading should be done as cautiously as possible, or one should exit the market to avoid a sharp price reversal against the preceding movement.
Beginners trading in the Forex market should remember that not every trade can be profitable. Developing a clear strategy and effective money management are key to long-term trading success.
*A análise de mercado aqui postada destina-se a aumentar o seu conhecimento, mas não dar instruções para fazer uma negociação.
InstaSpot analytical reviews will make you fully aware of market trends! Being an InstaSpot client, you are provided with a large number of free services for efficient trading.


