


Nossa equipe tem mais de 7,000,000 traders!
Todos os dias, trabalhamos juntos para melhorar a negociação. Obtivemos resultados elevados e avançamos.
O reconhecimento de milhões de traders em todo o mundo é a melhor apreciação do nosso trabalho! Você nos escolheu e faremos tudo o que for necessário para atender às suas expectativas!
Nós somos uma ótima equipe juntos!
InstaSpot. Orgulho de trabalhar para você!


Ator, hexacampeão do UFC e um verdadeiro herói!
Um homem de sucesso. Um homem que mostra o nosso caminho.
O segredo por trás do sucesso de Taktarov é um movimento constante em direção ao objetivo.
Revele todos os lados do seu talento!
Descubra, tente, falhe, mas nunca pare!
I InstaSpot. Sua história de sucesso começa aqui!
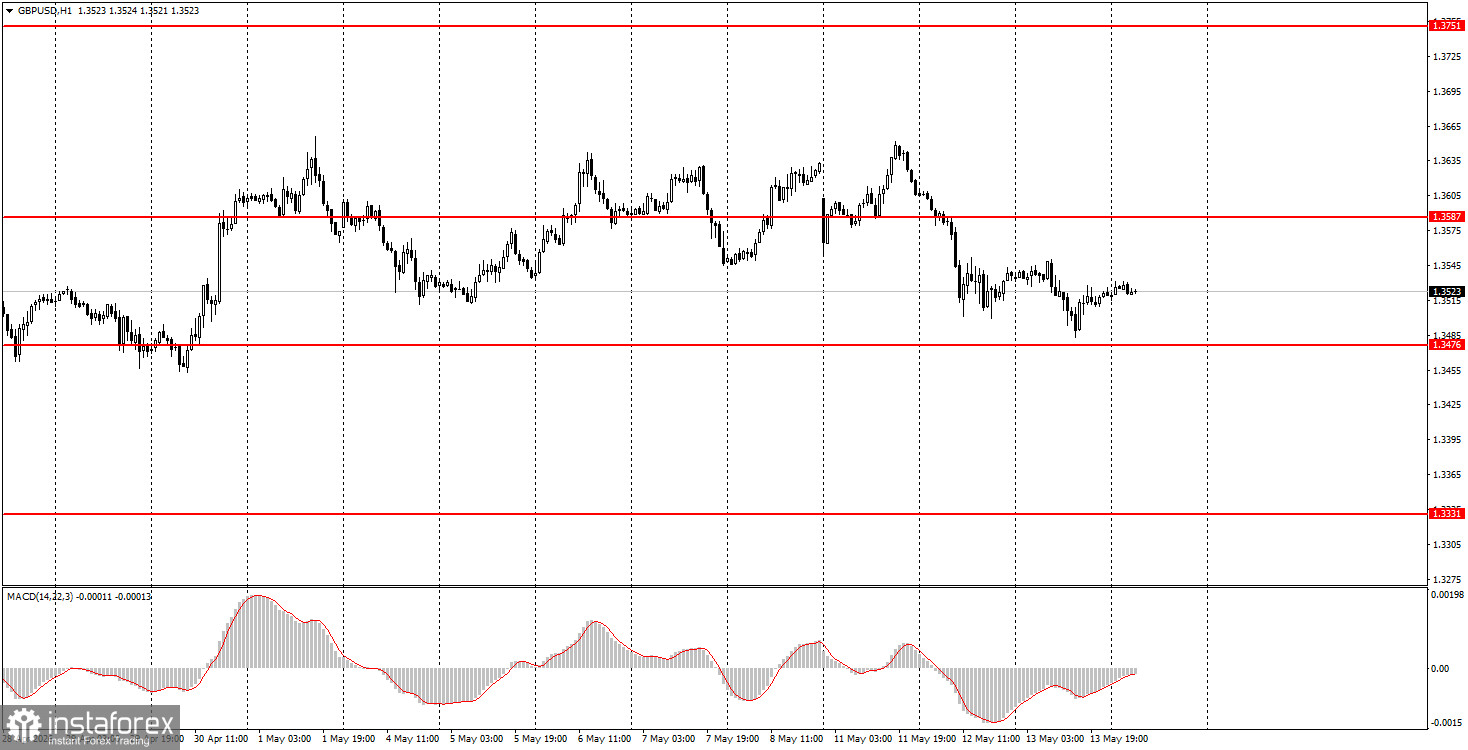
The GBP/USD pair attempted to continue its downward movement on Wednesday, but the plan failed. The market exhausted the grounds for selling the British pound and buying the US dollar. Zooming in on the hourly timeframe shows that the movements over the last three days have not affected the overall technical picture. Since April 14 (exactly one month), the GBP/USD pair has been trading in a flat range between 1.3450 and 1.3640. Yes, the sideways channel is wide enough for the hourly chart, but that is the reality. For a whole month, traders have not found new reasons for either an upward trend or a downward one. There is no real de-escalation or progress in negotiations between Iran and the US for the former. For the latter, there is no genuine escalation (just threats) and a complete failure in negotiations. Macroeconomic factors and expectations regarding central bank monetary policy are currently of no interest to the market. Another US inflation report was ignored yesterday, another the day before, and important labor-market data on unemployment were ignored last Friday.
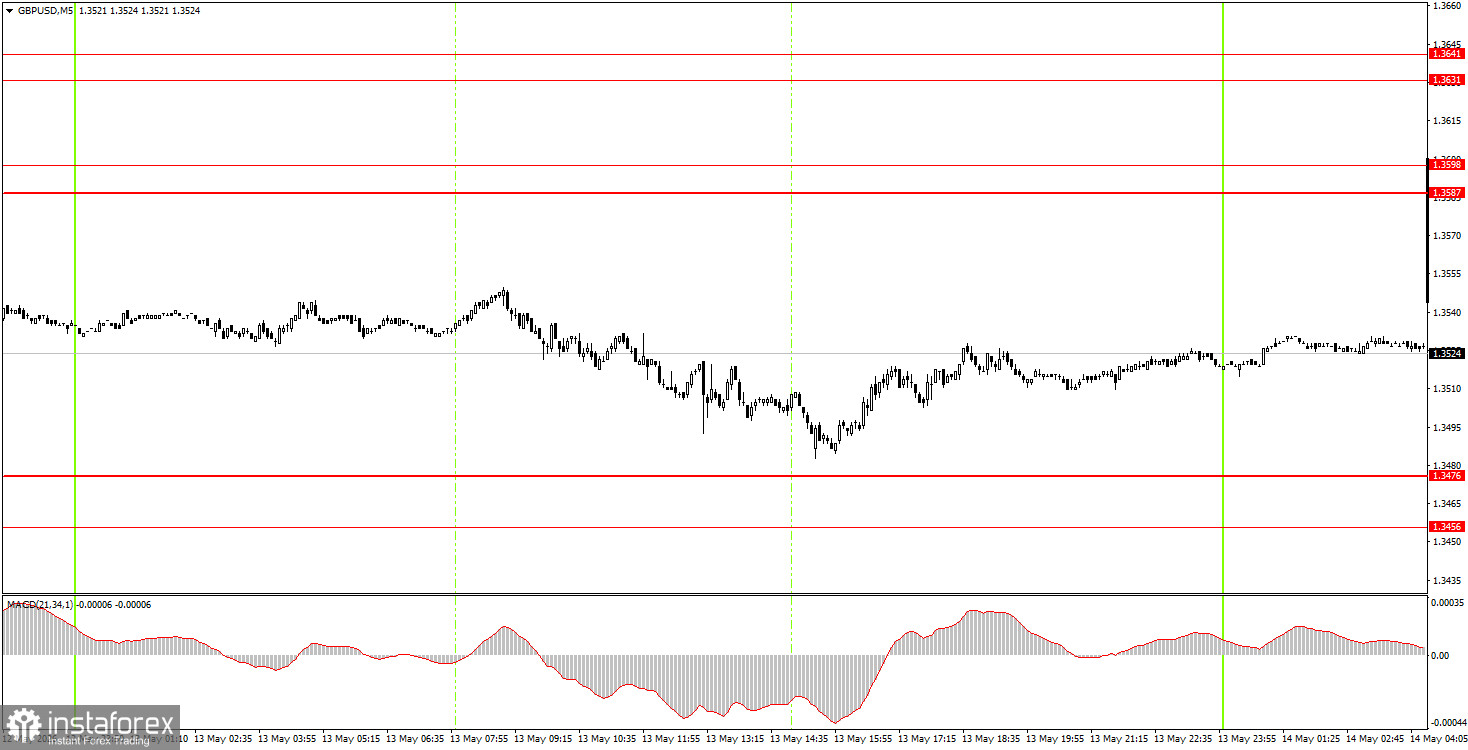
On the 5-minute timeframe, there were no trading signals formed on Wednesday. The last signal was created on Tuesday when the price breached the 1.3587-1.3598 area. Novice traders could easily carry the short position over to Wednesday. The target area of 1.3456-1.3476 has been practically fulfilled.
On the hourly timeframe, the GBP/USD pair remains in an upward trend but has been trading sideways for a month. Without a significant escalation in the Middle East, the dollar cannot be expected to rise as it did in February-March. Individual events may still provoke their strengthening, but overall, the geopolitical factor has weakened its influence on the market. The British currency retains excellent upward prospects according to the trends on the daily and weekly timeframes.
On Thursday, novice traders may open short positions targeting the 1.3456-1.3476 area if the pair bounces from the 1.3587-1.3598 area. A bounce from the 1.3456-1.3476 area will allow for opening long positions targeting 1.3587-1.3598.
On the 5-minute timeframe, the following levels can be traded: 1.3175-1.3180, 1.3259-1.3267, 1.3319-1.3331, 1.3380-1.3386, 1.3456-1.3476, 1.3587-1.3598, 1.3695, and 1.3741-1.3751. Today, reports on first-quarter GDP and industrial production will be released in the UK, which will likely also be ignored. In the US, retail sales data will be released.
Price levels (areas) of support and resistance – levels that are targets when opening purchases or sales, or sources of signals.
Red lines – channels or trend lines that display the current trend and indicate which direction is preferable to trade now.
MACD indicator (14, 22, 3) – histogram and signal line – a supporting indicator that can also be used as a source of signals.
Important speeches and reports (contained in the news calendar) can significantly influence the movement of the currency pair. Therefore, during their release, trading should be done as cautiously as possible, or one should exit the market to avoid a sharp price reversal against the preceding movement.
Beginners trading in the Forex market should remember that not every trade can be profitable. Developing a clear strategy and sound money management are key to long-term trading success.
*A análise de mercado aqui postada destina-se a aumentar o seu conhecimento, mas não dar instruções para fazer uma negociação.
InstaSpot analytical reviews will make you fully aware of market trends! Being an InstaSpot client, you are provided with a large number of free services for efficient trading.


