


A lenda da equipe InstaSpot!
Lenda! Você acha que isso é retórica bombástica? Mas como devemos chamar um homem que se tornou o primeiro asiático a vencer o campeonato mundial de xadrez aos 18 anos e que se tornou o primeiro grande mestre indiano aos 19? Esse foi o começo de um caminho difícil para o título de campeão do mundo para Viswanathan Anand, o homem que se tornou parte da história do xadrez para sempre. Agora mais uma lenda na equipe InstaSpot!


O Borussia é um dos clubes de futebol com mais títulos da Alemanha, que provou repetidamente aos fãs: o espírito de competição e liderança certamente levará ao sucesso. Negocie da mesma maneira que os profissionais do esporte jogam: com confiança e ativamente. Mantenha o "ritmo" do Borussia FC e esteja na liderança com a InstaSpot!
The EUR/USD currency pair continued its downward corrective movement on Wednesday. Volatility has remained quite low for several days, and the pair's decline is purely technical. However, it cannot be denied that the geopolitical backdrop may currently be providing muted support to the U.S. dollar, as the conflict in the Middle East has not shown signs of de-escalation in recent days. Despite a ceasefire being observed by all parties, there has been no progress in negotiations or movement towards talks. Thus, the market is slowly starting to believe that the energy crisis is long-lasting, that the deficit in oil and gas will persist, and that the tense situation in the Middle East is also here to stay, which supports demand for the U.S. dollar. However, we reiterate that we believe the influence of geopolitical factors has weakened, so the decline in the pair over the last few days may be purely technical.
On the hourly timeframe, the upward trend remains intact, and the pair should stay above the trendline and the Senkou Span B line. For a stronger U.S. dollar, substantial reasons will be required, such as a full-scale resumption of war in the Middle East. For now, we expect the price to bounce off one of the lines and resume its growth.
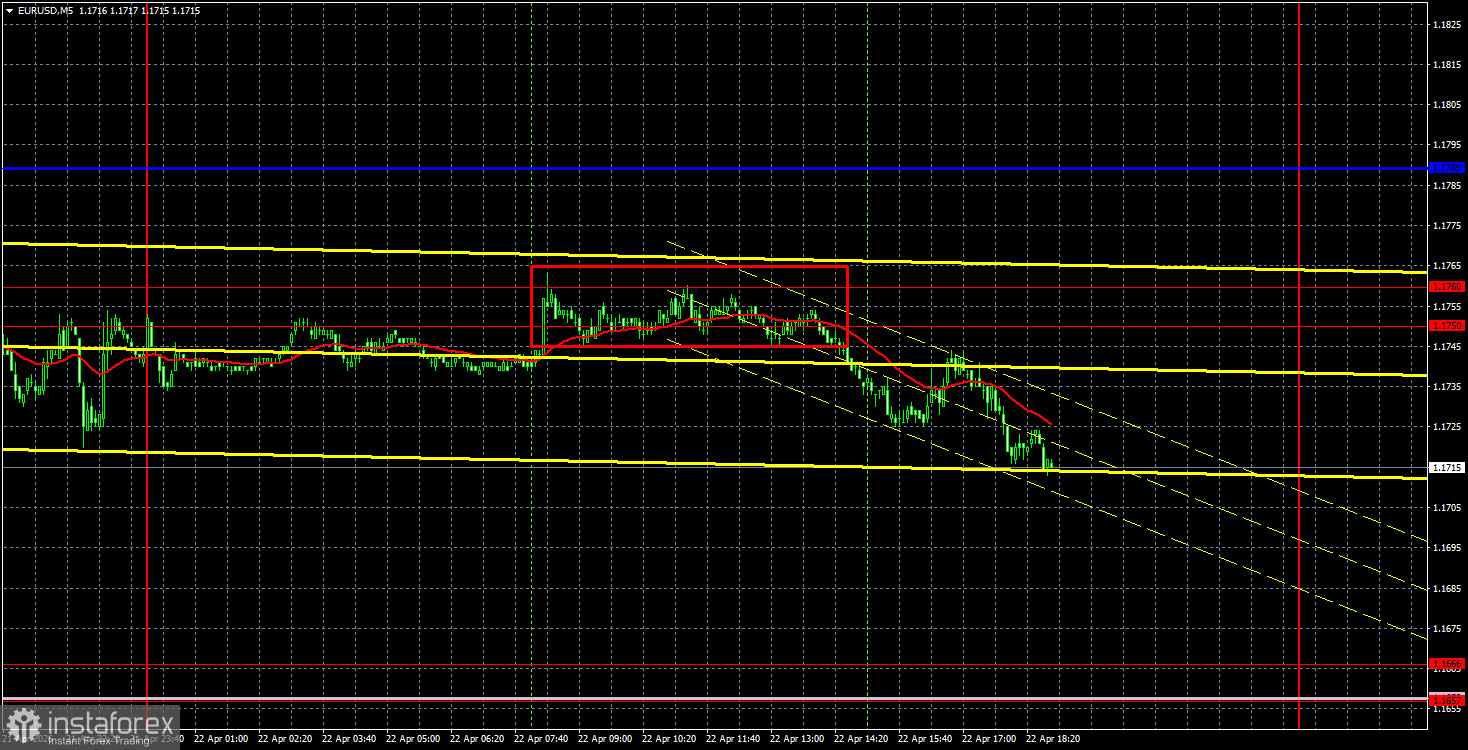
On the 5-minute timeframe, one trading signal was formed on Wednesday. The pair bounced from the 1.1750-1.1760 area during the European session, and it eventually did so. During the American session, the euro currency only declined, allowing traders to gain about 25 pips. Volatility during the day was weak again.
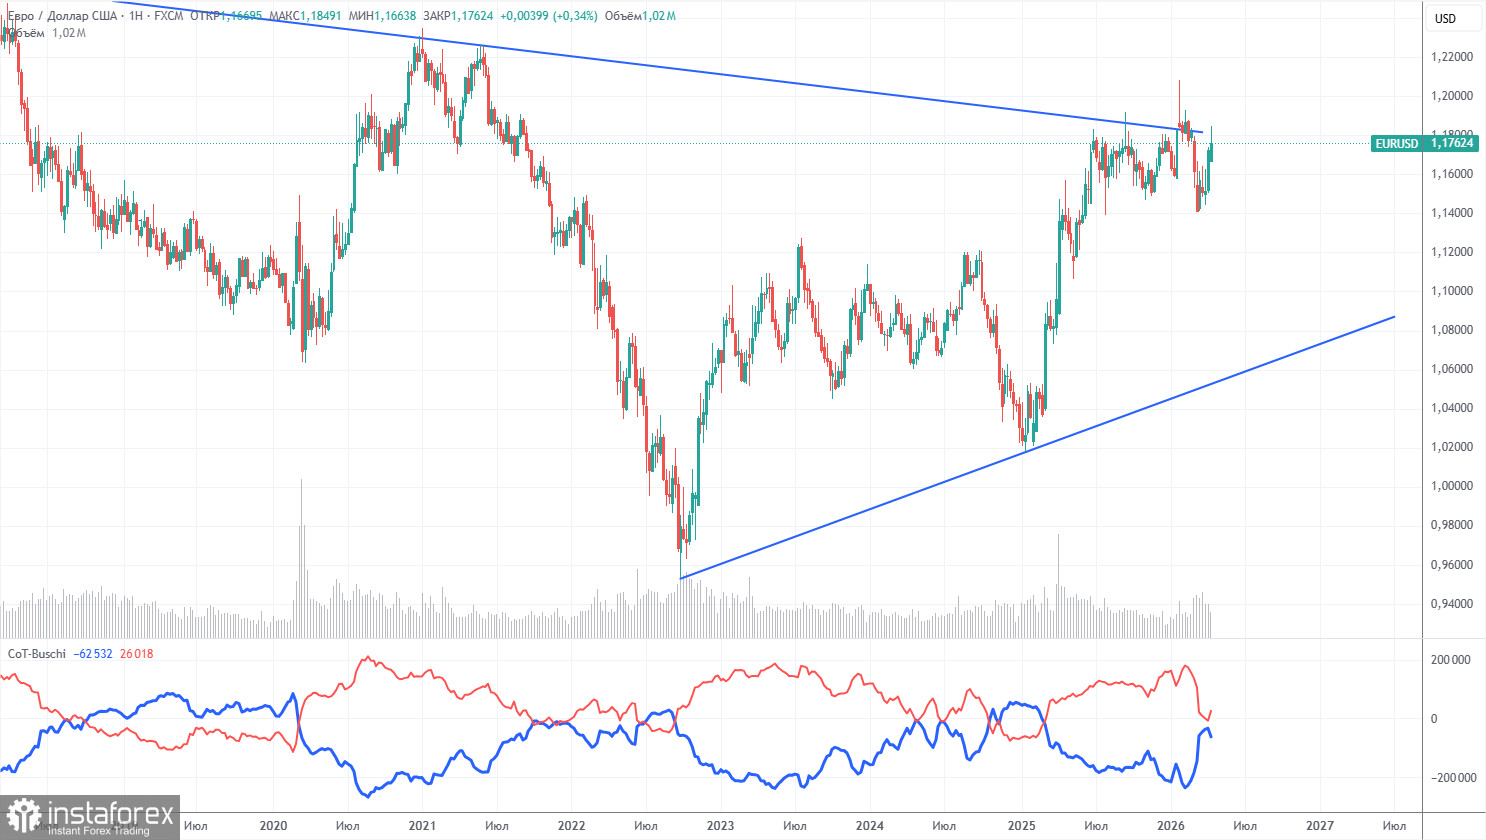
The latest COT report is dated April 14. The illustration of the weekly timeframe clearly shows that the net position of non-commercial traders remains "bullish," but is rapidly declining due to geopolitical events. Traders are dumping the euro in favor of the U.S. dollar. Trump's policy has not changed, but the dollar is now acting as a "reserve currency," which ensures high demand for it.
We still do not see any fundamental factors that would strengthen the euro, while there are plenty of factors that would weaken the U.S. dollar. The war in the Middle East has made the dollar temporarily super-attractive, but when this factor runs out of "shelf life," everything will revert to the way it was. In the long term, the euro can fall to as low as 1.06 (the trendline), but the upward trend will remain relevant. As of now, the pair has not moved far from the descending trendline, which has been broken several times.
The positioning of the red and blue lines of the indicator indicates parity between bulls and bears. Over the last reporting week, the number of longs in the "Non-commercial" group increased by 13,700, while the number of shorts decreased by 19,900. Consequently, the net position increased by 33,600 contracts over the week.
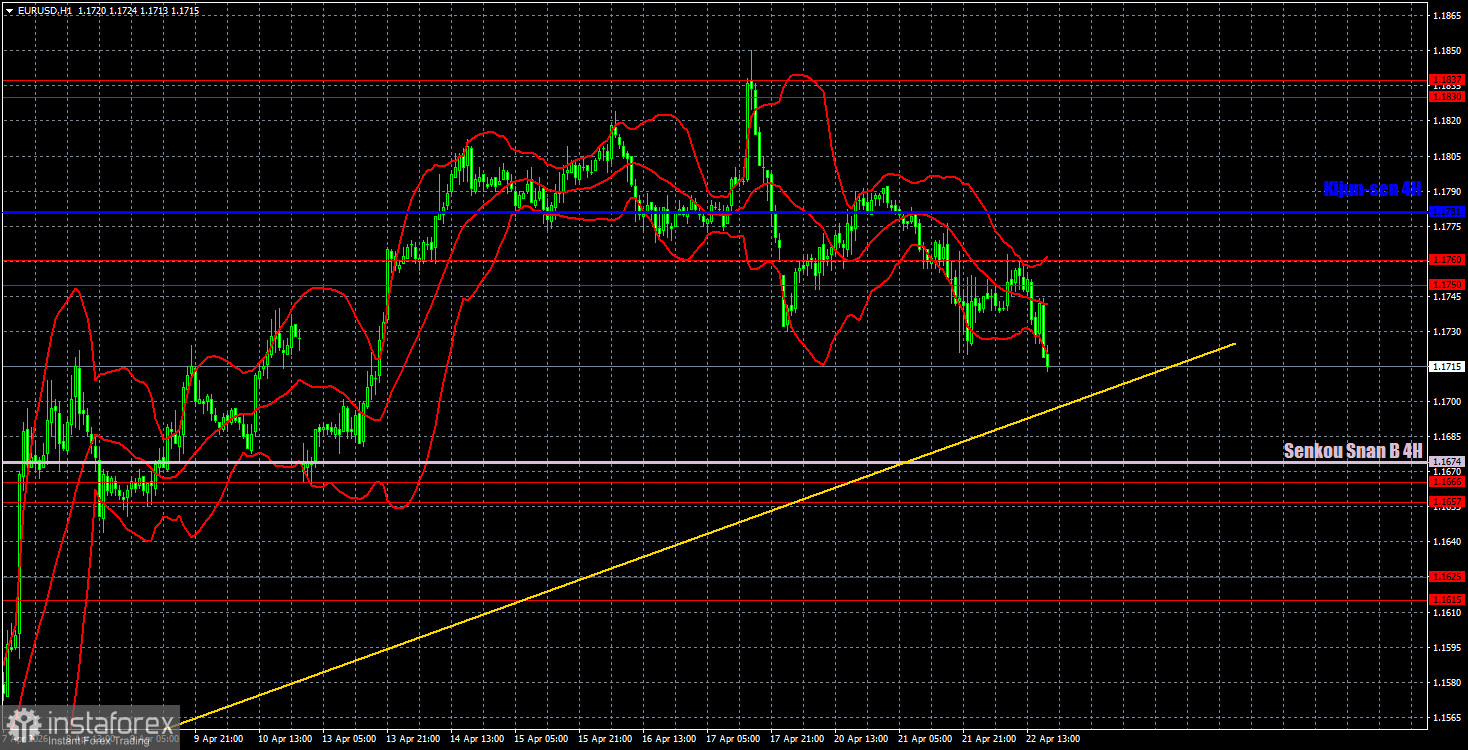
On the hourly timeframe, the EUR/USD pair continues to form an upward trend, but is currently in a corrective phase. A new escalation in the Middle East could once again shift traders' priorities, so the pair's decline cannot be ruled out. The situation in the Middle East remains tense but is not worsening, so there are few strong reasons for a new strengthening of the U.S. dollar. There are no technical grounds to expect the pair to fall below 1.1400.
For April 23, we highlight the following levels for trading: 1.1362, 1.1426, 1.1542, 1.1615-1.1625, 1.1657-1.1666, 1.1750-1.1760, 1.1830-1.1837, 1.1907-1.1922, as well as the Senkou Span B line (1.1674) and Kijun-sen line (1.1781). The Ichimoku indicator lines may move during the day, which should be taken into account when determining trading signals. Do not forget to set your Stop Loss order to breakeven if the price moves in the correct direction by 15 pips. This will protect against potential losses if the signal turns out to be false.
On Thursday, reports on business activity in the services and manufacturing sectors for April will be published in the EU, Germany, and the US. It is worth recalling that American indices are of little significance, and the market is currently not favoring macroeconomic data in general. Therefore, volatility on Thursday may remain low, and the correction may continue.
On Thursday, traders may remain in short positions after the price consolidates below the 1.1750-1.1760 area, targeting the trendline and the Senkou Span B line. Long positions can be opened on a bounce from the trendline or the Senkou Span B line with a target of 1.1750-1.1760.
Price levels of support and resistance – thick red lines, around which the movement may end. They are not sources of trading signals.
Kijun-sen and Senkou Span B lines – lines of the Ichimoku indicator that are carried over to the hourly timeframe from the 4-hour one. They are strong lines.
Extreme levels – thin red lines from which the price has previously bounced. They are sources of trading signals.
Yellow lines – trend lines, trend channels, and any other technical patterns.
Indicator 1 on COT charts – the size of the net position of each category of traders.
*A análise de mercado aqui postada destina-se a aumentar o seu conhecimento, mas não dar instruções para fazer uma negociação.
InstaSpot analytical reviews will make you fully aware of market trends! Being an InstaSpot client, you are provided with a large number of free services for efficient trading.


