


Nossa equipe tem mais de 7,000,000 traders!
Todos os dias, trabalhamos juntos para melhorar a negociação. Obtivemos resultados elevados e avançamos.
O reconhecimento de milhões de traders em todo o mundo é a melhor apreciação do nosso trabalho! Você nos escolheu e faremos tudo o que for necessário para atender às suas expectativas!
Nós somos uma ótima equipe juntos!
InstaSpot. Orgulho de trabalhar para você!


Ator, hexacampeão do UFC e um verdadeiro herói!
Um homem de sucesso. Um homem que mostra o nosso caminho.
O segredo por trás do sucesso de Taktarov é um movimento constante em direção ao objetivo.
Revele todos os lados do seu talento!
Descubra, tente, falhe, mas nunca pare!
I InstaSpot. Sua história de sucesso começa aqui!
Bitcoin continues to trade within a sideways channel, and the technical picture has not changed for a month. This week, the price dropped to the lower boundary of the channel, but neither a rebound nor a deviation was formed. After that, the price began to move toward the upper boundary of the range, so in the coming days, we can expect the formation of a new deviation or at least a rebound. However, the essence remains the same—a total sideways movement.
Overall, Bitcoin still shows no signs of rising. Investors are not in a hurry to protect their capital from future inflation, additional central bank issuance, and the war in the Middle East. All global markets are in turmoil, while the cryptocurrency market is marked by stability and even stagnation. The fundamental and macroeconomic backdrop has had no impact on Bitcoin's movements, regardless of what anyone says. The price has been in a range for a month; what influence can fundamentals have under such circumstances? In just the last 10 days, the situation in the Middle East has worsened several times, yet Bitcoin has continued to trade within the sideways channel.
Meanwhile, the largest public holder of Bitcoin, the company Strategy, guess what? Correct. They have purchased another 7,000 Bitcoins for $500 million. Sometimes it seems that only former MicroStrategy is buying Bitcoin now. It appears that Michael Saylor's company fundamentally does not want to deviate from its strategy of enriching itself through "digital gold." We previously stated that Strategy buys Bitcoin at any price, not even waiting for a pullback, correction, or a downward trend. Consequently, their Bitcoin investments are currently at a loss.
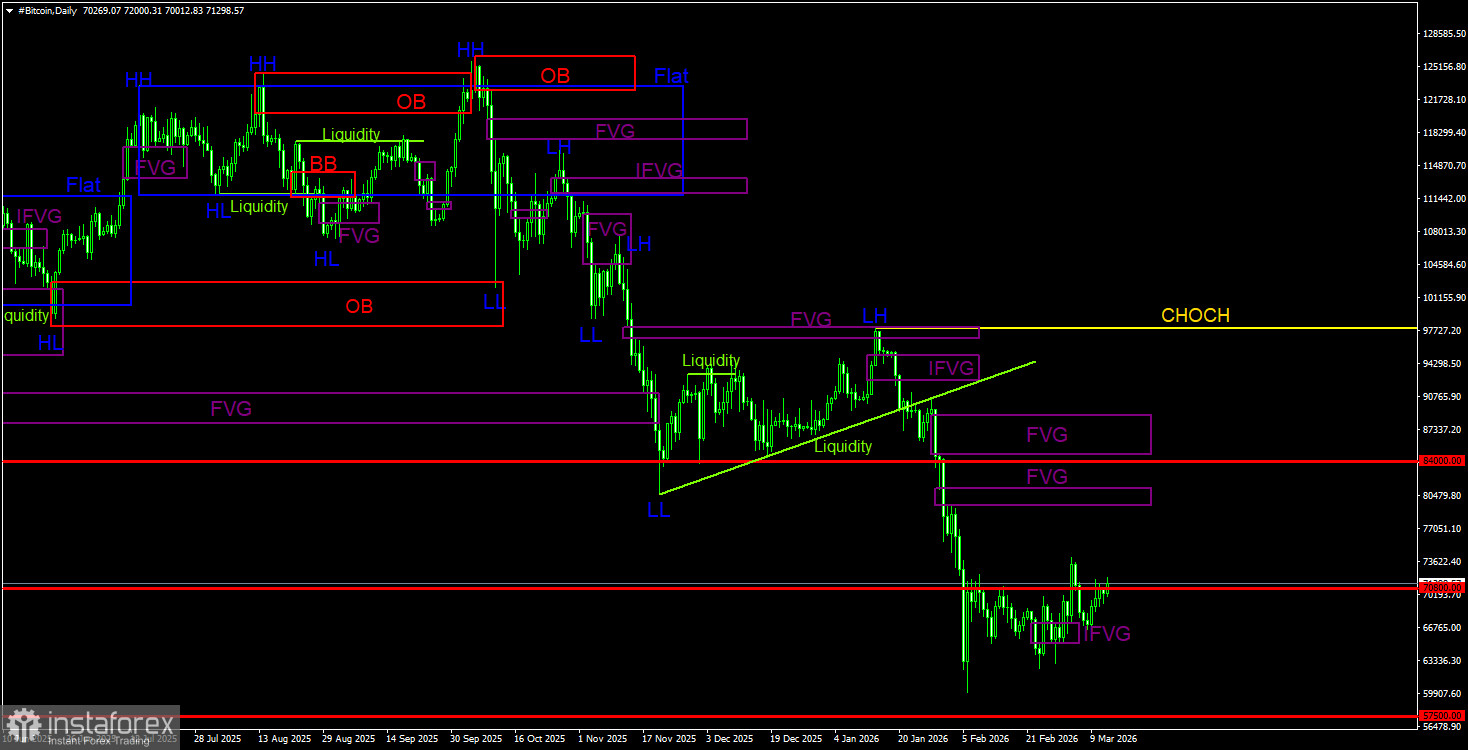
On the daily timeframe, Bitcoin continues to form a downward trend. The trend structure is identified as bearish, and the CHOCH line is currently at the level of $97,900. Only above this level can we consider the downward trend to have ended. Recall that a sell signal was formed within a "bearish" FVG ($96,900 – $98,000). Thus, traders had an excellent opportunity to capture nearly the entire recent downward movement. The current target for the decline remains at $57,500, which corresponds to the 61.8% Fibonacci from the three-year upward trend. As there are no signs of a trend reversal to the bullish at this time, we believe that the decline will continue. The nearest area of POI for new sell trades is in the range of $79,500 – $81,100. However, the 4-hour timeframe remains in consolidation.
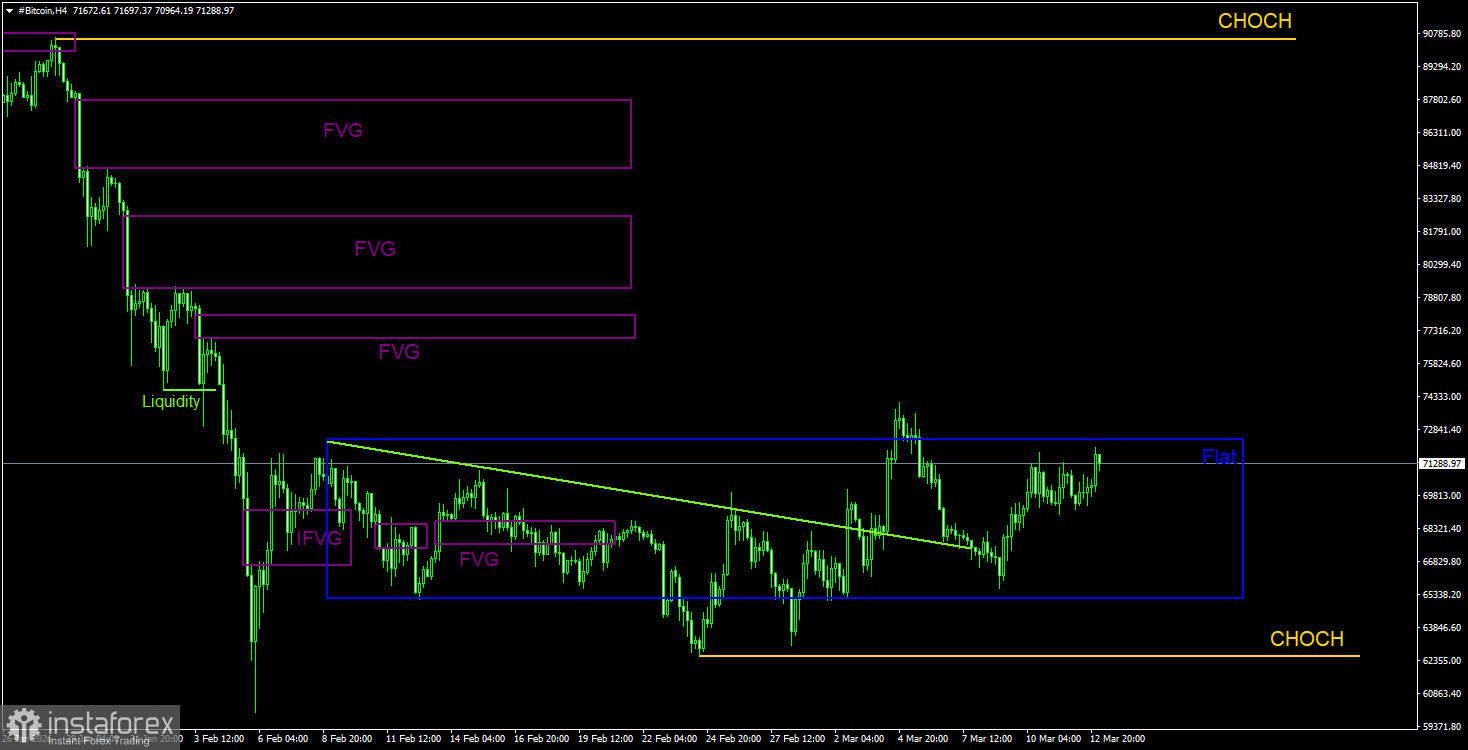
On the 4-hour timeframe, the price also continues to form a downward structure. The CHOCH line is at $90,560; only above that level can we discuss the trend turning bullish. There is also another CHOCH line, which serves as support for an upward correction that began on February 6. Breaching this line will indicate the completion of the correction. Currently, there are no signs that Bitcoin may complete its downward trend in the near future. The sideways trend persists. We have observed two deviations at the lower boundary of the channel and one at the upper boundary. As expected, the price retraced to the lower boundary and then began moving back up. A typical consolidation.
Bitcoin continues to establish a full-fledged downward trend. We still anticipate a decline to $57,500 (the 61.8% Fibonacci of the three-year upward trend), with no signs of a trend reversal at this time. Even the $57,500 level no longer appears to be a definitive stopping point. Currently, the nearest bearish FVG on the daily timeframe is located quite far from the price. In the near future, on the 4-hour timeframe, we can expect a new deviation at the upper boundary of the channel, as the price is currently moving toward it.
*A análise de mercado aqui postada destina-se a aumentar o seu conhecimento, mas não dar instruções para fazer uma negociação.
InstaSpot analytical reviews will make you fully aware of market trends! Being an InstaSpot client, you are provided with a large number of free services for efficient trading.


