


Nossa equipe tem mais de 7,000,000 traders!
Todos os dias, trabalhamos juntos para melhorar a negociação. Obtivemos resultados elevados e avançamos.
O reconhecimento de milhões de traders em todo o mundo é a melhor apreciação do nosso trabalho! Você nos escolheu e faremos tudo o que for necessário para atender às suas expectativas!
Nós somos uma ótima equipe juntos!
InstaSpot. Orgulho de trabalhar para você!


Ator, hexacampeão do UFC e um verdadeiro herói!
Um homem de sucesso. Um homem que mostra o nosso caminho.
O segredo por trás do sucesso de Taktarov é um movimento constante em direção ao objetivo.
Revele todos os lados do seu talento!
Descubra, tente, falhe, mas nunca pare!
I InstaSpot. Sua história de sucesso começa aqui!
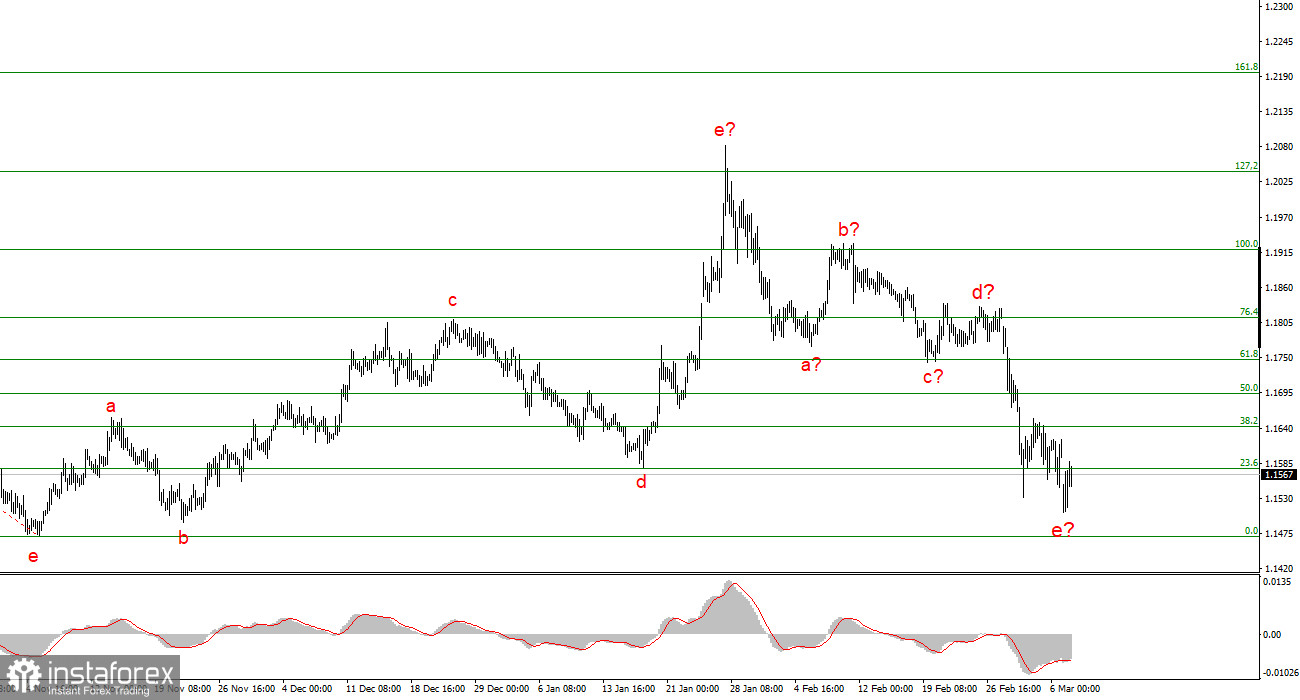
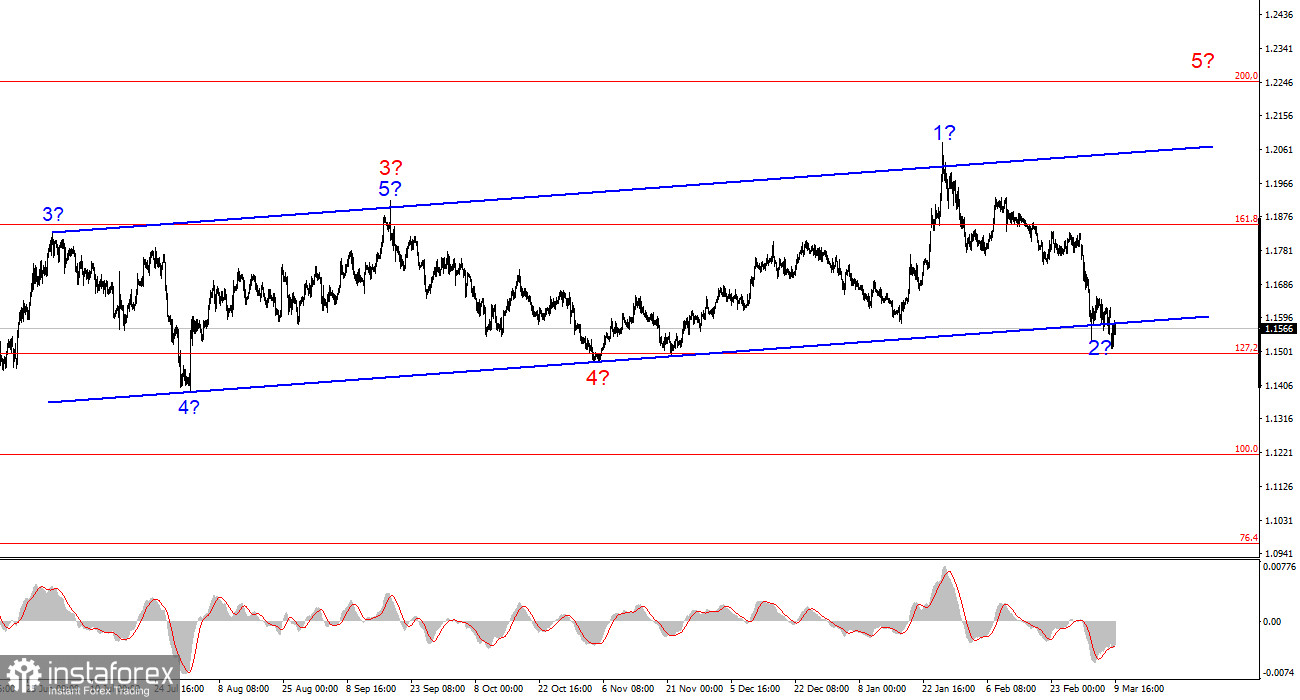
O padrão de ondas no gráfico de 4 horas para o par EUR/USD assumiu uma aparência menos favorável, mas ainda não levanta grandes dúvidas. Ainda não se fala em cancelar o segmento de tendência de alta que começou em janeiro do ano passado; apenas a estrutura interna das ondas é ajustada ocasionalmente. Na minha opinião, o par já concluiu a formação da onda global 4 (gráfico inferior). Se essa suposição estiver correta, então a formação da onda 5 está atualmente em andamento e pode tornar-se bastante prolongada, com alvos chegando até o nível 25.
A estrutura interna da suposta onda 5 não está totalmente clara (gráfico superior). O conjunto de ondas de alta não pode ser considerado impulsivo, devido à presença de correções relativamente fortes. Por isso, no momento ele é interpretado como a-b-c-d-e. No entanto, se a onda 5 se estender, sua estrutura interna também poderá se tornar bastante complexa. Espero que o par EUR/USD retome a trajetória de alta, e a estrutura corretiva a-b-c-d-e já parece praticamente concluída. Infelizmente, ela pode se prolongar ainda mais devido ao conflito no Oriente Médio.
O par EUR/USD caiu apenas 50 pontos na segunda-feira em comparação com o fechamento da semana passada. Cinquenta pontos, nas circunstâncias atuais, é muito pouco; a moeda europeia deve considerar-se afortunada por ter sofrido perdas relativamente pequenas. A crise energética está ganhando ímpeto e continua a pesar sobre a moeda europeia. Infelizmente, o problema não se limita ao petróleo ou ao GNL. Por que a moeda europeia reage de forma tão dolorosa?
Antes de mais nada, convém notar que não é apenas o euro que está em queda. Por exemplo, a libra britânica tem recuado em um ritmo semelhante. Isso significa que o mercado teme, primordialmente, não a crise energética, nem a desaceleração econômica, nem a alta da inflação. O que assusta é o risco — e o mercado foge dele. A zona do euro é de fato muito vulnerável a qualquer alteração no mercado de energia. Contudo, o Brent subiu, na verdade, menos de US$ 30 na última semana. Isso ainda é muito, mas não se trata (ainda) de um aumento duas ou três vezes maior, que poderia ser verdadeiramente devastador para a economia europeia.
O petróleo é fornecido aos mercados globais não apenas pelo Irã ou por países do Oriente Médio. Ele também pode ser adquirido em outras partes do mundo. O preço pode ser mais alto, mas pagar mais não significa necessariamente uma sentença de morte para uma economia. Na minha opinião, os investidores não estão excessivamente preocupados com uma desaceleração da economia europeia, sua completa paralisação ou algo semelhante. Em vez disso, a moeda dos Estados Unidos está se valorizando porque a demanda por ela está aumentando devido à grave situação geopolítica no Oriente Médio.
Se essa suposição estiver correta, então apenas uma nova escalada do conflito poderá levar a novas compras do dólar. Infelizmente, ainda não há sinais de desescalada.
Com base na análise do EUR/USD, concluo que o par continua formando um segmento de tendência de alta. As políticas de Donald Trump e a política monetária da Reserva Federal permanecem fatores importantes por trás da queda de longo prazo do dólar americano. Os alvos do segmento atual da tendência podem se estender até o nível 25.
No momento, acredito que o par ainda permanece dentro da onda global 5, por isso espero que as cotações continuem subindo durante o primeiro semestre de 2026. A estrutura corretiva a-b-c-d-e pode terminar a qualquer momento, já que parece bastante convincente. Considero que agora é razoável buscar zonas e níveis para novas posições de compra, com alvos próximos de 1,2195 e 1,2367, que correspondem aos níveis de retração de Fibonacci 161,8% e 200,0%.
No intervalo menor, todo o segmento de tendência de alta é visível. A estrutura de ondas não é das mais padrão, já que as ondas corretivas possuem tamanhos diferentes. Por exemplo, a onda 2 principal é menor do que a onda 2 interna dentro da onda 3. No entanto, isso às vezes acontece. Vale lembrar que é melhor identificar estruturas claras nos gráficos, em vez de vincular rigidamente a análise a cada onda individual. No momento, a estrutura de ondas de alta não levanta dúvidas.
*A análise de mercado aqui postada destina-se a aumentar o seu conhecimento, mas não dar instruções para fazer uma negociação.
InstaSpot analytical reviews will make you fully aware of market trends! Being an InstaSpot client, you are provided with a large number of free services for efficient trading.


