


O Bitcoin continua em trajetória de queda, sem sinais claros de correção. No gráfico diário, observa-se que nenhum dos três últimos FVGs (Lacunas de Valor Justo) foi trabalhado. O mesmo padrão se repete no intervalo de 4 horas, onde os três FVGs mais recentes também permanecem intactos.
O que isso indica? Que o Bitcoin não está corrigindo. Na melhor das hipóteses, o movimento recente sugere apenas lateralização, e não uma recuperação técnica. Cenários assim costumam ser raros. Ontem, a principal criptomoeda do mercado chegou a cair abaixo de US$ 74.000, e esse movimento ainda parece distante do possível limite de desvalorização.
Seguimos avaliando que uma tendência de baixa está em formação, com potencial de se estender por pelo menos um ano. Se já existe uma estrutura baixista e não há sequer indícios de uma correção altista modesta, o viés para o Bitcoin permanece claramente negativo.
Nosso alvo técnico continua sendo US$ 70.800, nível que não está distante dos preços atuais. Nos últimos seis meses, o Bitcoin acumulou uma desvalorização de cerca de 40%, o que, em termos históricos, ainda é relativamente contido. Para efeito de comparação, o Ethereum, a segunda maior criptomoeda do mercado, já perdeu aproximadamente 56% de seu valor no mesmo período.
Vale lembrar que todas as grandes tendências de alta do Bitcoin, no passado, terminaram com quedas entre 70% e 80%. Isso indica que ainda há espaço relevante para novas perdas. Para traders, o ponto central não é discutir preferências ou narrativas, mas identificar corretamente a tendência dominante. Já os investidores, de forma mais ampla, têm adotado uma postura defensiva, reduzindo exposição a criptoativos e migrando para metais preciosos mais estáveis e ações.
Enquanto isso, diversos "especialistas em cripto" seguem tentando atrair compradores para um mercado em queda. Robert Kiyosaki voltou a afirmar que está apenas comprando Bitcoin, enquanto Cathie Wood sugeriu vender ouro e prata para ampliar posições em BTC. Esses nomes podem, eventualmente, estar certos — mas é fundamental lembrar que são investidores de longo prazo, não traders.
Nos próximos 6 a 8 meses, o Bitcoin ainda pode sofrer quedas adicionais significativas, antes que qualquer estrutura mais sólida de recuperação venha a se formar.
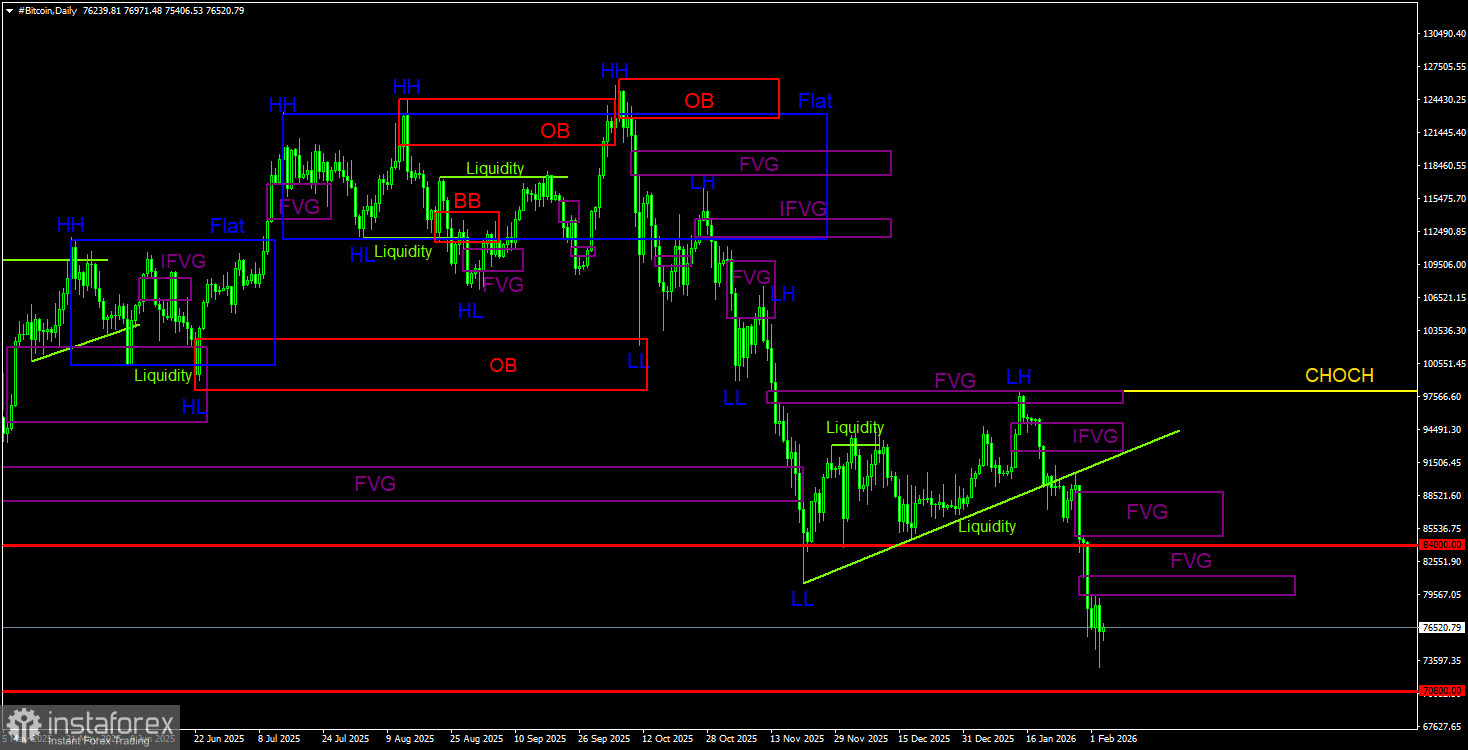
No gráfico diário, o Bitcoin continua a formar uma tendência de baixa. A estrutura permanece claramente baixista, com a linha de CHOCH atualmente em US$ 97.900. Apenas um rompimento e consolidação acima desse nível permitiria considerar o fim da tendência de queda. Em 2026, o Bitcoin pode recuar para a região de US$ 60.000, de onde teve início sua última perna de alta. Com apenas um mês do novo ano, o ativo já caiu para US$ 74.000, o que reforça a pressão vendedora no curto e médio prazo.
O preço reagiu de forma clara ao FVG de baixa na faixa de US$ 96.900–US$ 98.000, gerando um sinal técnico relevante. Desde então, o Bitcoin já perdeu cerca de US$ 20.000. O alvo do movimento de baixa atual permanece em US$ 70.800, correspondente ao nível de retração de 50,0% de Fibonacci. Entre as novas áreas de interesse (POI) para vendas, destacam-se um IFVG de baixa e dois FVGs de baixa adicionais. No futuro, oportunidades de negociação poderão ser estruturadas com base nesses padrões técnicos.
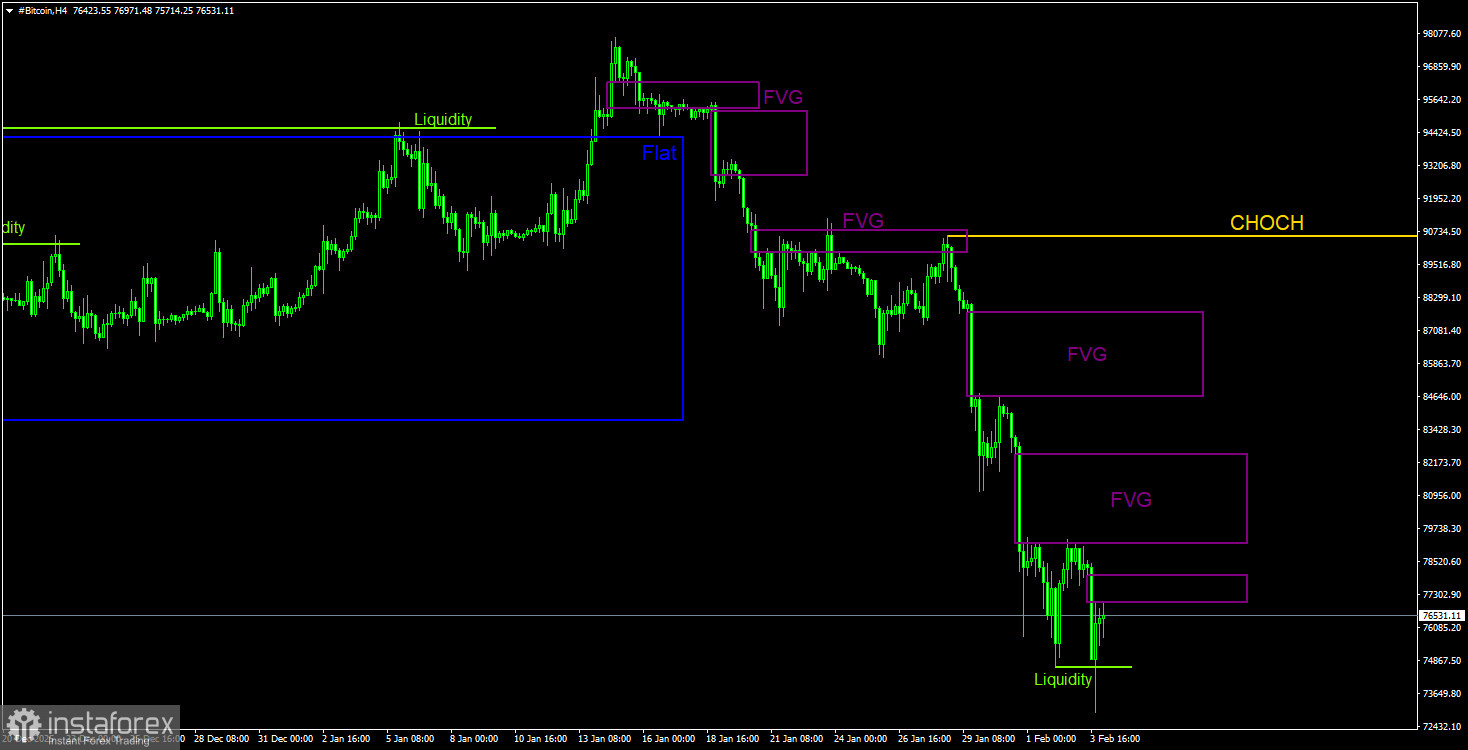
No gráfico de 4 horas, o preço segue formando uma nova estrutura baixista. A linha de CHOCH está agora em US$ 90.560; somente acima desse nível será possível afirmar que a tendência começa a se transformar em ascendente.
No entanto, até o momento, não há sinais de que o Bitcoin esteja prestes a encerrar esse movimento de queda. Pelo contrário, o preço vem caindo em velocidade relâmpago, sem apresentar sequer correções mínimas.
Durante o último trecho do declínio, formaram-se três FVGs de baixa, e o preço ainda não chegou a corrigir até nenhum deles. A remoção de liquidez do lado comprador sinaliza a possibilidade de um repique, mas, por enquanto, esse é o único indício de potencial alta.
O Bitcoin segue formando uma tendência de baixa bem definida. Mantemos a expectativa de queda até US$ 70.800 (nível de 50,0% de Fibonacci de uma tendência de alta de três anos), sem sinais de reversão ou mesmo de correção no movimento.
Entre as áreas de POI para vendas no gráfico diário, destacam-se um IFVG de baixa e dois FVGs de baixa. No intervalo gráfico de 4 horas, três FVGs de baixa podem gerar oportunidades para a abertura de novas posições vendidas. Os padrões mais próximos são os que despertam maior interesse.
*A análise de mercado aqui postada destina-se a aumentar o seu conhecimento, mas não dar instruções para fazer uma negociação.
InstaSpot analytical reviews will make you fully aware of market trends! Being an InstaSpot client, you are provided with a large number of free services for efficient trading.


