


Nossa equipe tem mais de 7,000,000 traders!
Todos os dias, trabalhamos juntos para melhorar a negociação. Obtivemos resultados elevados e avançamos.
O reconhecimento de milhões de traders em todo o mundo é a melhor apreciação do nosso trabalho! Você nos escolheu e faremos tudo o que for necessário para atender às suas expectativas!
Nós somos uma ótima equipe juntos!
InstaSpot. Orgulho de trabalhar para você!


Ator, hexacampeão do UFC e um verdadeiro herói!
Um homem de sucesso. Um homem que mostra o nosso caminho.
O segredo por trás do sucesso de Taktarov é um movimento constante em direção ao objetivo.
Revele todos os lados do seu talento!
Descubra, tente, falhe, mas nunca pare!
I InstaSpot. Sua história de sucesso começa aqui!
Analysis: The analysis of the European currency chart indicates that the corrective bearish wave that started in April of this year continues its formation. The wave level of all price movements lacks reversal potential, continuing the development of the current structure. The unfinished wave segment dates back to September 16 and has formed a counterpullback over the last month.
Forecast: This week, the likelihood of the euro major continuing its sideways movement remains. In the early days, a price decline toward the calculated support is expected. A brief spike below its lower boundary is not ruled out. Increased volatility and a return to a bullish trend can be anticipated by the end of the week.
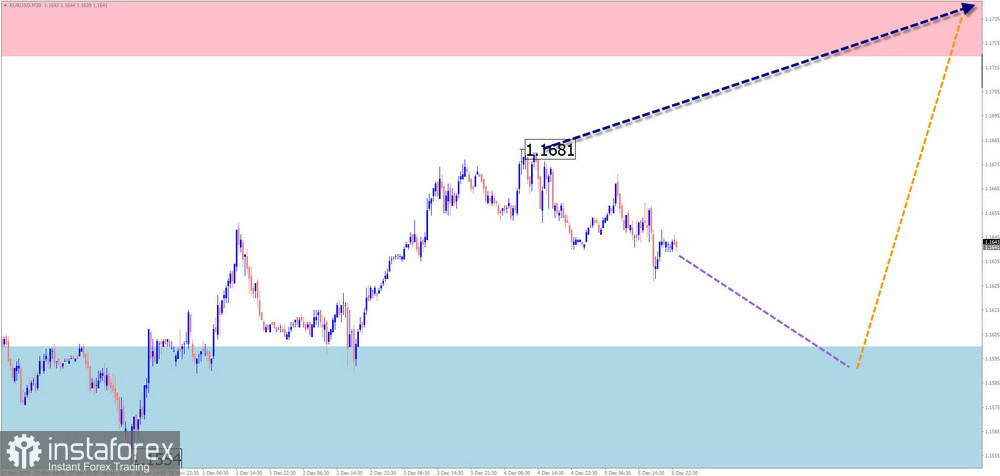
Potential Reversal Zones:
Recommendations:
Analysis: The direction of the price movement for the Japanese yen is set by the unfinished upward wave. The current downward segment, formed in early October, serves as a correction to the previous upward segment. Within the stretched wave structure, the final part (C) is still lacking.
Forecast: In the coming days, a sideways movement is expected, most likely with an upward vector. A reversal at the calculated resistance area is anticipated, along with a change in direction and a downward movement. The opposing zones demonstrate the anticipated weekly range of the pair.
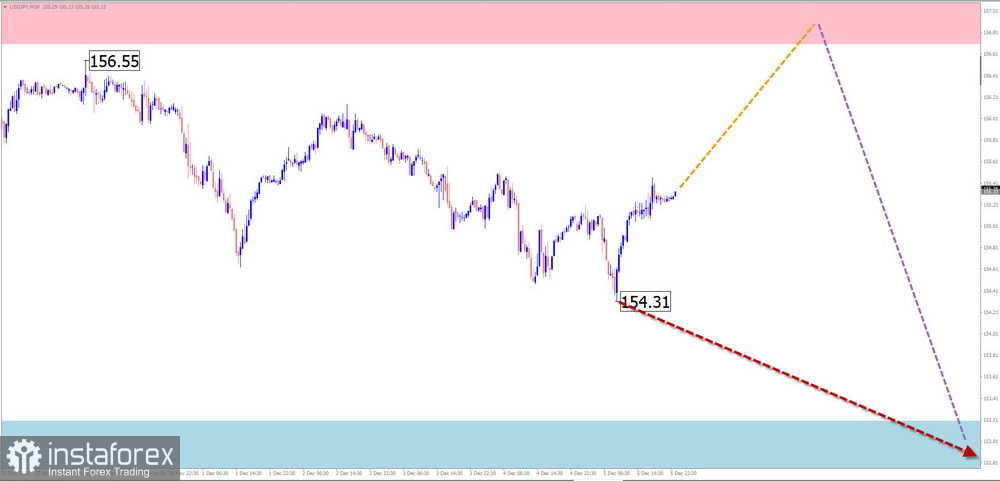
Potential Reversal Zones:
Recommendations:
Analysis: The incomplete upward trend segment on the GBP/JPY cross chart began in early October. Over the past two months, the quotes have predominantly moved sideways, forming a corrective stretched plane. The middle part (B) is nearing completion.
Forecast: In the coming days, a general horizontal movement along the boundaries of the calculated resistance is expected. A stopping of the ascent and a reversal within the control zone can be anticipated. A downward move is unlikely to extend beyond the support zone.
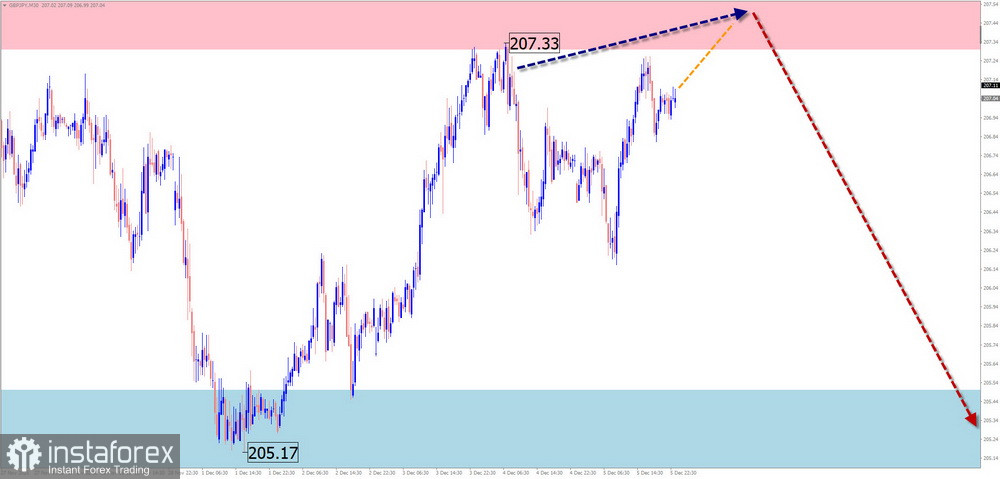
Potential Reversal Zones:
Recommendations:
Analysis: The direction of the Canadian dollar's price movement is dictated by the unfinished downward wave since February 3. The final part (C) started a month ago. The quotes pushed through a strong support zone, opening the path to the next control area.
Forecast: After a likely pullback to the resistance zone, the pair is expected to reverse and actively move downward in the coming days. During the direction change, a brief spike through the upper boundary of the reversal zone is not out of the question. The calculated support limits the pair's weekly downward movement.
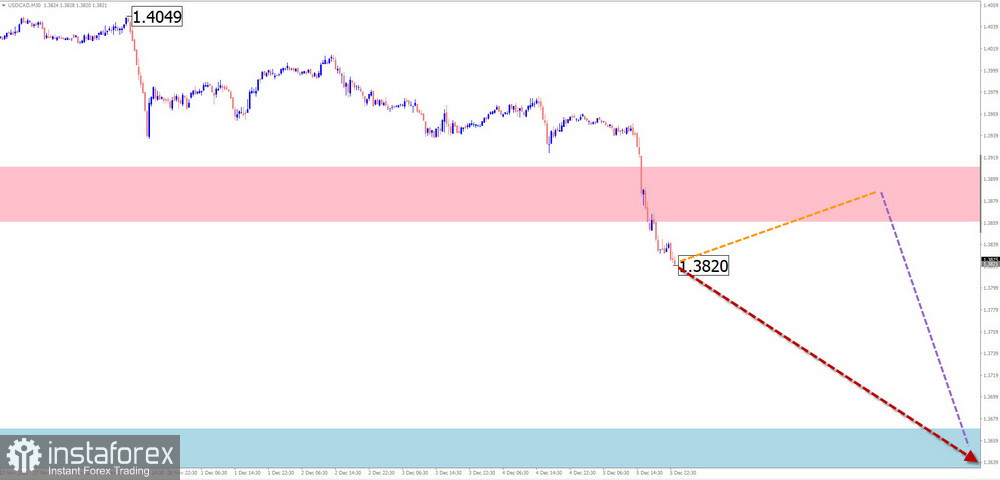
Potential Reversal Zones:
Recommendations:
Brief Analysis: The direction of the short-term trend for the New Zealand dollar major has been bullish since April. By the end of November, the quotes reached a strong reversal zone. Over the last two weeks, an upward segment with reversal potential has formed. Once confirmed, this will mark the start of the final part (C).
Weekly Forecast: The upcoming week is expected to see price movement within the corridor between the nearest opposing target zones. Initially, pressure on the support zone cannot be ruled out. A return to the upward trend and a rise to the resistance zone can be anticipated either by the end of the current week or early next week.
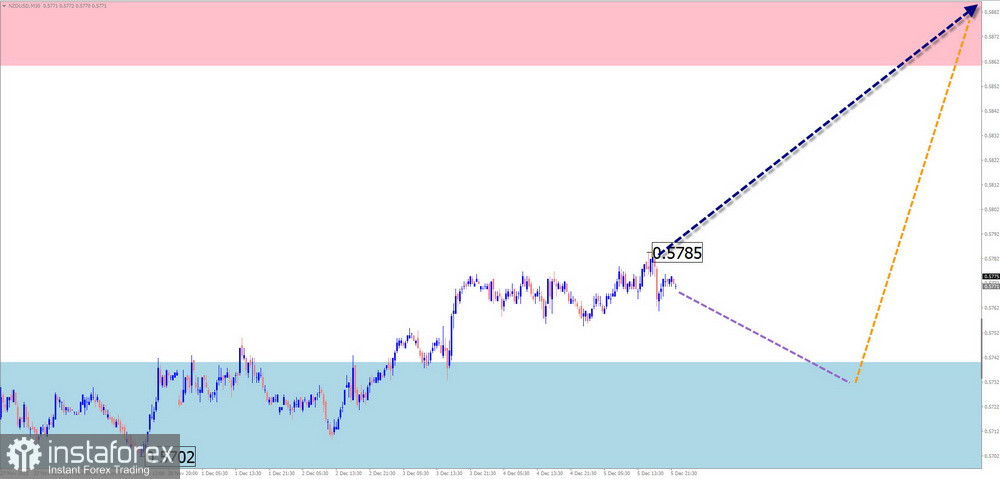
Potential Reversal Zones:
Recommendations:
Analysis: After gold prices reached peak values at the end of October, the instrument has been retracing. The analysis of the corrective wave shows the absence of the concluding part (C) in its structure. The lower boundary of a powerful potential reversal zone passes near the calculated resistance.
Forecast: A repeated attempt to retrace to the resistance zone can be expected in the next couple of days. Then, a directional change and a start of decline towards the calculated support are highly probable. The most significant volatility is anticipated towards the week's end.
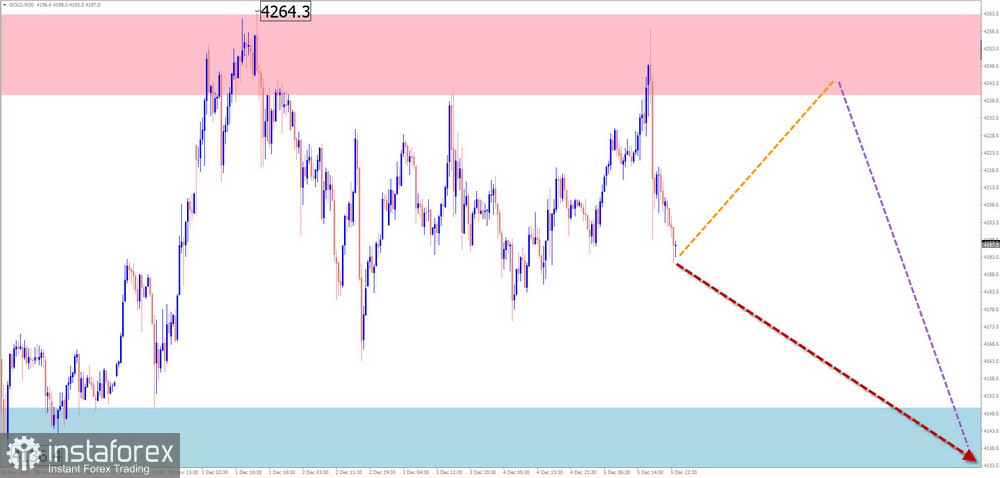
Potential Reversal Zones:
Recommendations:
In the simplified wave analysis (SWA), all waves consist of 3 parts (A-B-C). In each timeframe, the last incomplete wave is analyzed. Dotted lines indicate expected movements.
Attention: The wave algorithm does not take into account the duration of movements over time for the instruments!
*A análise de mercado aqui postada destina-se a aumentar o seu conhecimento, mas não dar instruções para fazer uma negociação.
InstaSpot analytical reviews will make you fully aware of market trends! Being an InstaSpot client, you are provided with a large number of free services for efficient trading.


