


Nossa equipe tem mais de 7,000,000 traders!
Todos os dias, trabalhamos juntos para melhorar a negociação. Obtivemos resultados elevados e avançamos.
O reconhecimento de milhões de traders em todo o mundo é a melhor apreciação do nosso trabalho! Você nos escolheu e faremos tudo o que for necessário para atender às suas expectativas!
Nós somos uma ótima equipe juntos!
InstaSpot. Orgulho de trabalhar para você!


Ator, hexacampeão do UFC e um verdadeiro herói!
Um homem de sucesso. Um homem que mostra o nosso caminho.
O segredo por trás do sucesso de Taktarov é um movimento constante em direção ao objetivo.
Revele todos os lados do seu talento!
Descubra, tente, falhe, mas nunca pare!
I InstaSpot. Sua história de sucesso começa aqui!
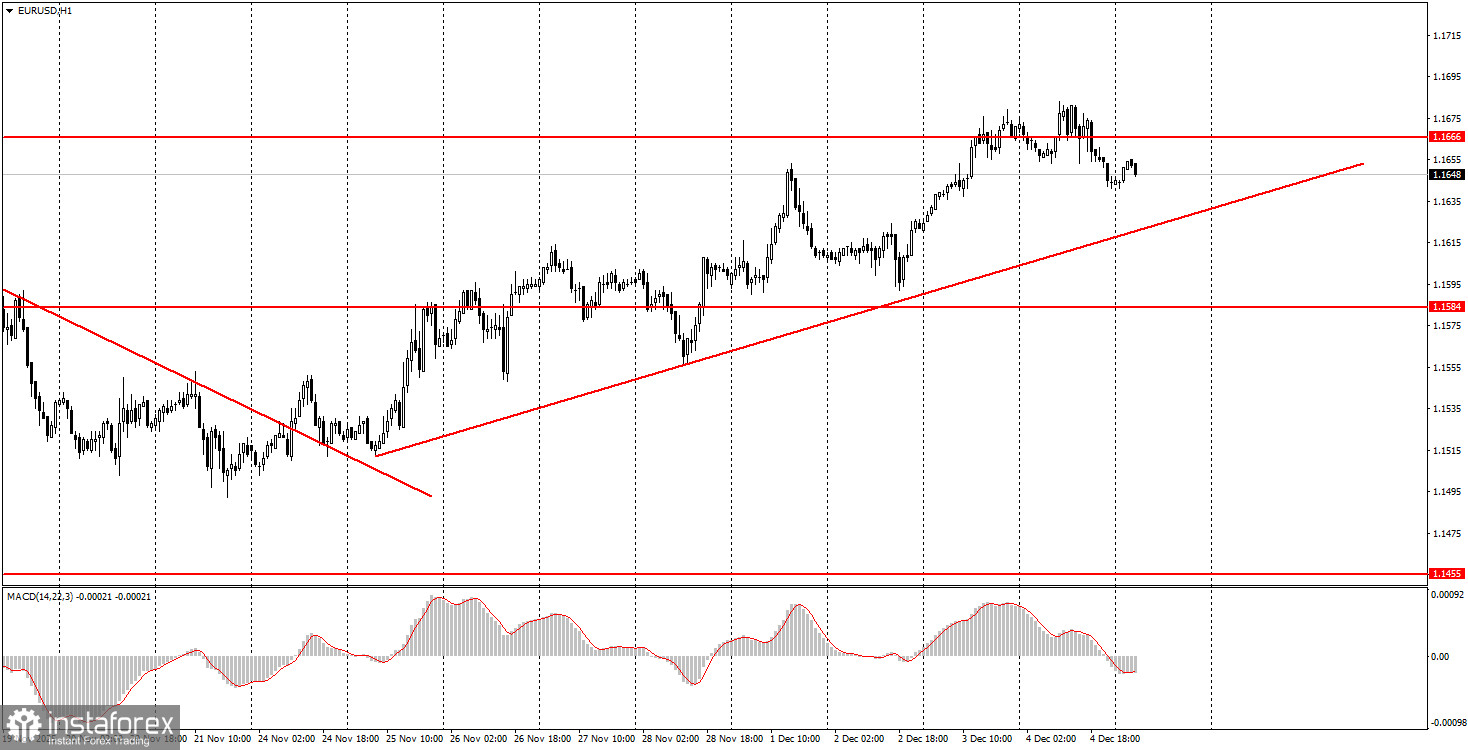
The EUR/USD currency pair traded once again in a "neither fish nor fowl" style on Thursday. The macroeconomic backdrop throughout the day was very weak, so the market found no grounds to open new positions. Overall, this week we have already seen several important reports, most of which have had no impact. Almost all European reports (some quite significant) were ignored by the market, while the American reports were somewhat contradictory and provoked a mixed market reaction. For example, the important ISM Manufacturing Index was worse than expected, while the similar index for the services sector exceeded traders' expectations. The key report is rightly considered the ADP report, although it is usually not deemed significant, even with a stretch. However, it is currently the only indicator that allows for some idea of the state of the US labor market. The indicator failed, and the dollar continues its decline as expected. The flat pattern on the daily timeframe remains relevant, so the pair's volatility remains low.
On the hourly timeframe, the EUR/USD pair continues to form an upward trend. The overall fundamental and macroeconomic background remains very weak for the US dollar; therefore, we expect further growth. Even technical factors currently support the euro, as the flat pattern on the daily timeframe persists, and after turning around near the lower boundary, it is reasonable to expect a rise to the upper boundary.
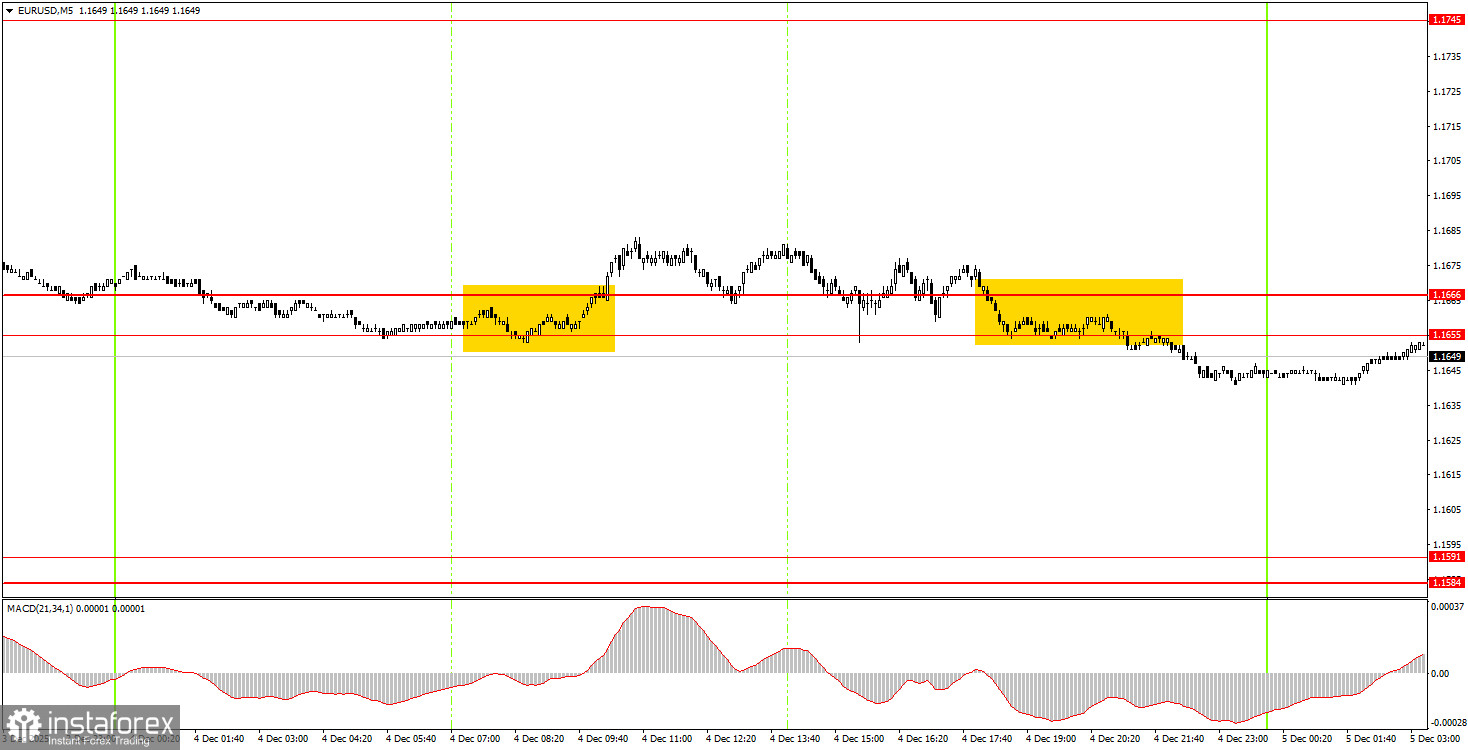
On Friday, novice traders may again trade from the area of 1.1655-1.1666, as there are simply no other options. A bounce from this area downwards will allow for opening short positions with a target of 1.1584-1.1591. A consolidation above this area will lead to long positions with a target of 1.1745.
On the 5-minute timeframe, levels to consider include 1.1354-1.1363, 1.1413, 1.1455-1.1474, 1.1527-1.1531, 1.1550, 1.1584-1.1591, 1.1655-1.1666, 1.1745-1.1754, 1.1808, 1.1851, 1.1908, and 1.1970-1.1988. On Friday, the Eurozone is scheduled to release its third-quarter GDP report. In the US, personal income and expenditures of American consumers, the core personal consumption expenditures price index, and the University of Michigan consumer sentiment index will be published. None of these reports is considered important, but they can provoke a certain market reaction.
Important Note: Significant speeches and reports (always included in the news calendar) can greatly influence the movement of the currency pair. Therefore, during their release, it is advisable to trade cautiously or exit the market to avoid sharp reversals against the preceding movement.
Remember: For beginners trading in the Forex market, it is important to understand that not every trade can be profitable. Developing a clear strategy and practicing money management are keys to long-term trading success.
*A análise de mercado aqui postada destina-se a aumentar o seu conhecimento, mas não dar instruções para fazer uma negociação.
InstaSpot analytical reviews will make you fully aware of market trends! Being an InstaSpot client, you are provided with a large number of free services for efficient trading.


