


A lenda da equipe InstaSpot!
Lenda! Você acha que isso é retórica bombástica? Mas como devemos chamar um homem que se tornou o primeiro asiático a vencer o campeonato mundial de xadrez aos 18 anos e que se tornou o primeiro grande mestre indiano aos 19? Esse foi o começo de um caminho difícil para o título de campeão do mundo para Viswanathan Anand, o homem que se tornou parte da história do xadrez para sempre. Agora mais uma lenda na equipe InstaSpot!


O Borussia é um dos clubes de futebol com mais títulos da Alemanha, que provou repetidamente aos fãs: o espírito de competição e liderança certamente levará ao sucesso. Negocie da mesma maneira que os profissionais do esporte jogam: com confiança e ativamente. Mantenha o "ritmo" do Borussia FC e esteja na liderança com a InstaSpot!
Trend Analysis
This week, from the 1.3466 level (close to the last weekly candle), the price may continue to decline toward the target of 1.3270 – a historical support level (light blue dashed line). Upon testing this level, the price may rebound upward toward 1.3389 – the 23.6% retracement level (red dashed line).
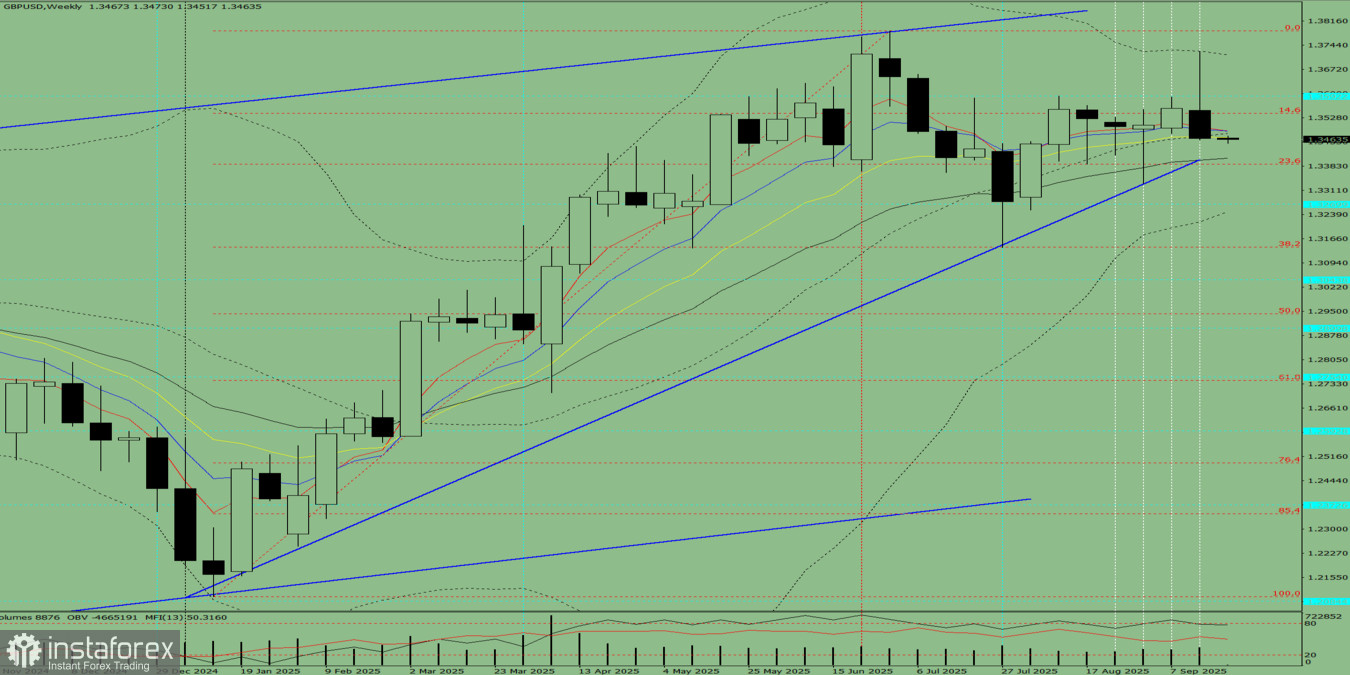
Fig. 1 (weekly chart)
Comprehensive Analysis:
Overall forecast for the GBP/USD weekly candle: the price will most likely follow a downward trend throughout the week, with no upper shadow on the weekly black (bearish) candle (Monday – downside movement), and a lower shadow present (Friday – upward rebound).
Alternative Scenario: From the 1.3466 level (close of the last weekly candle), the price may start by continuing its downward movement toward 1.3389 – the 23.6% retracement level (red dashed line). Upon reaching this level, a price increase toward 1.3470 – the 13-period EMA (yellow thin line) is possible.
*A análise de mercado aqui postada destina-se a aumentar o seu conhecimento, mas não dar instruções para fazer uma negociação.
InstaSpot analytical reviews will make you fully aware of market trends! Being an InstaSpot client, you are provided with a large number of free services for efficient trading.


