


A lenda da equipe InstaSpot!
Lenda! Você acha que isso é retórica bombástica? Mas como devemos chamar um homem que se tornou o primeiro asiático a vencer o campeonato mundial de xadrez aos 18 anos e que se tornou o primeiro grande mestre indiano aos 19? Esse foi o começo de um caminho difícil para o título de campeão do mundo para Viswanathan Anand, o homem que se tornou parte da história do xadrez para sempre. Agora mais uma lenda na equipe InstaSpot!


O Borussia é um dos clubes de futebol com mais títulos da Alemanha, que provou repetidamente aos fãs: o espírito de competição e liderança certamente levará ao sucesso. Negocie da mesma maneira que os profissionais do esporte jogam: com confiança e ativamente. Mantenha o "ritmo" do Borussia FC e esteja na liderança com a InstaSpot!
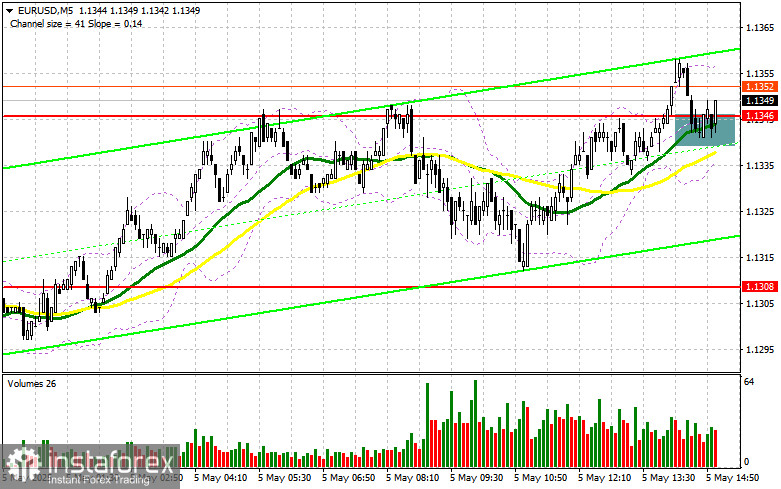
In my morning forecast, I focused on the 1.1346 level and planned to make trading decisions based on it. Let's look at the 5-minute chart and see what happened. A breakout and retest of 1.1346 led to an entry point for buying the euro, but so far, a major rally has not materialized. The technical picture has not been revised for the second half of the day.
To open long positions on EURUSD:
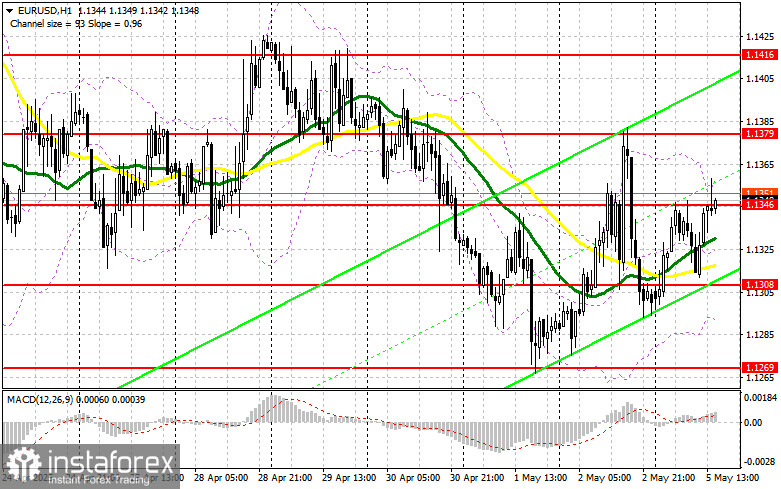
The second half of the day could pose a challenge for the U.S. dollar due to the expectation of rather weak fundamental data. All traders' attention will be focused on the PMI for the services sector, the composite PMI, and the ISM services index for April. A drop below the 50-point threshold may be a turning point for the economy. If the pair declines, I plan to act from the 1.1308 support formed at the end of last week. A false breakout there will be a signal to buy EUR/USD with the aim of a recovery toward 1.1346, where trading is currently concentrated, leaving room to activate the morning entry point. A breakout and retest of this range will confirm the correct entry point with a move toward 1.1379. The most distant target will be the 1.1416 level, where I will take profit. If EUR/USD falls and there is no activity around 1.1308, pressure on the pair may increase significantly, potentially leading to a move toward 1.1269. Only after forming a false breakout there will I act to buy the euro. I plan to open long positions on a rebound from 1.1219 aiming for an intraday upward correction of 30–35 points.
To open short positions on EURUSD:
If the euro rises after U.S. data, which is also likely, bears will need to assert themselves around 1.1346. Only a false breakout there will justify short positions aiming for a drop to the 1.1308 support, where the moving averages are located in favor of the bulls. A breakout and consolidation below this range would be a suitable selling scenario with a move toward 1.1269. The furthest target will be 1.1219, where I will take profit. Testing this level would break the bullish market. If EUR/USD rises in the second half of the day and bears fail to act near 1.1346, buyers could push the pair to 1.1379. I will only sell there after a failed consolidation. I plan to open short positions on a rebound from 1.1416, aiming for a downward correction of 30–35 points.
Indicator signals:
Moving averages Trading is taking place around the 30- and 50-day moving averages, indicating market uncertainty.
Note: The moving average periods and prices are based on the author's analysis of the hourly (H1) chart and differ from the standard definitions on the daily (D1) chart.
Bollinger Bands In case of a decline, the lower boundary of the indicator around 1.1275 will act as support.
Indicator descriptions
*A análise de mercado aqui postada destina-se a aumentar o seu conhecimento, mas não dar instruções para fazer uma negociação.
InstaSpot analytical reviews will make you fully aware of market trends! Being an InstaSpot client, you are provided with a large number of free services for efficient trading.


