


Nossa equipe tem mais de 7,000,000 traders!
Todos os dias, trabalhamos juntos para melhorar a negociação. Obtivemos resultados elevados e avançamos.
O reconhecimento de milhões de traders em todo o mundo é a melhor apreciação do nosso trabalho! Você nos escolheu e faremos tudo o que for necessário para atender às suas expectativas!
Nós somos uma ótima equipe juntos!
InstaSpot. Orgulho de trabalhar para você!


Ator, hexacampeão do UFC e um verdadeiro herói!
Um homem de sucesso. Um homem que mostra o nosso caminho.
O segredo por trás do sucesso de Taktarov é um movimento constante em direção ao objetivo.
Revele todos os lados do seu talento!
Descubra, tente, falhe, mas nunca pare!
I InstaSpot. Sua história de sucesso começa aqui!
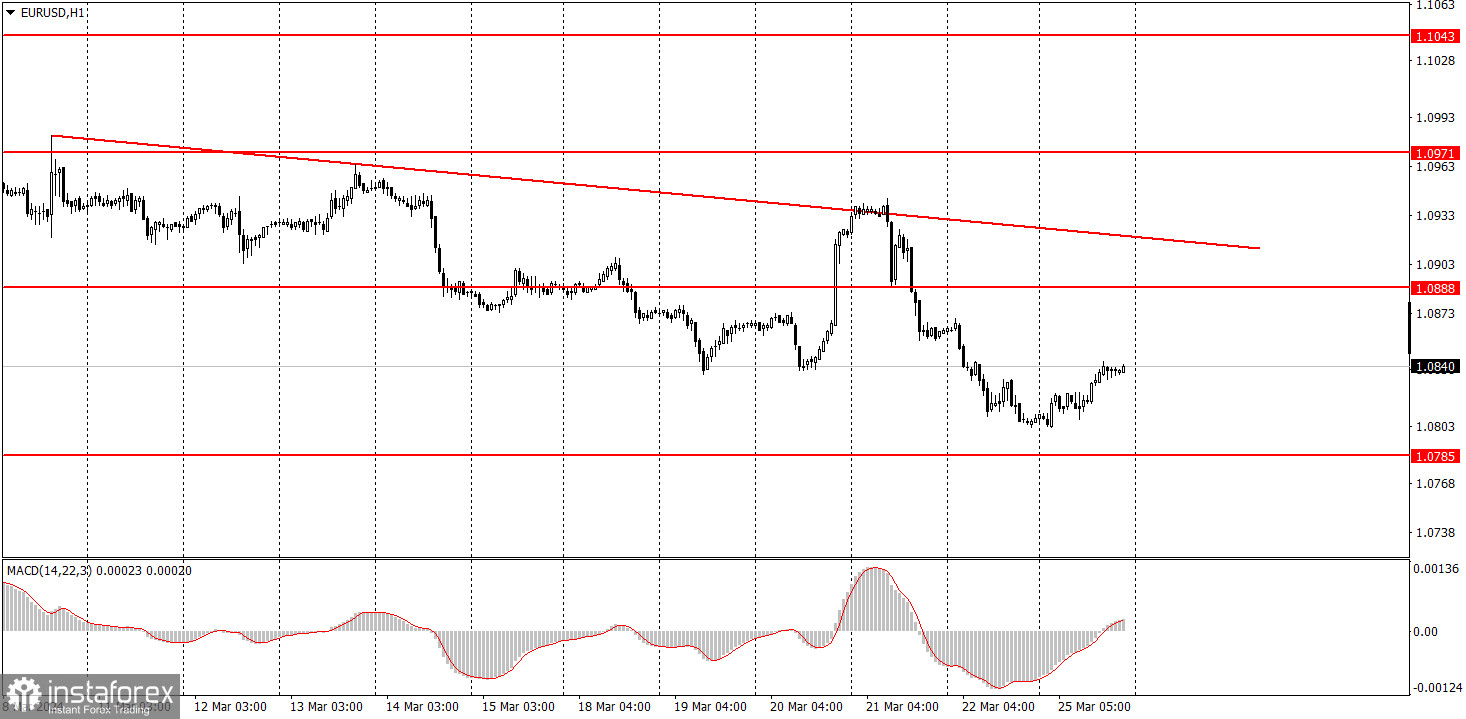
EUR/USD started a bullish correction on Monday, which is entirely consistent with the current technical picture. The descending trendline remains relevant but is positioned quite far from the price. Its slope angle is relatively weak, so the pair may undergo a significant correction while the downtrend persists. We believe that Monday fully met expectations, both ours and that of some traders. This time we did not see the traditional "boring Monday," but volatility, as expected, was low, and the correction after a two-day decline seemed natural. Although we considered the possibility that the pair would continue to fall.
There were no notable macroeconomic or fundamental events on Monday. European Central Bank President Christine Lagarde spoke, but as of now, there is no information about it. Judging by the calm and sluggish movements of the pair, we can assume that Lagarde did not convey any significant information.
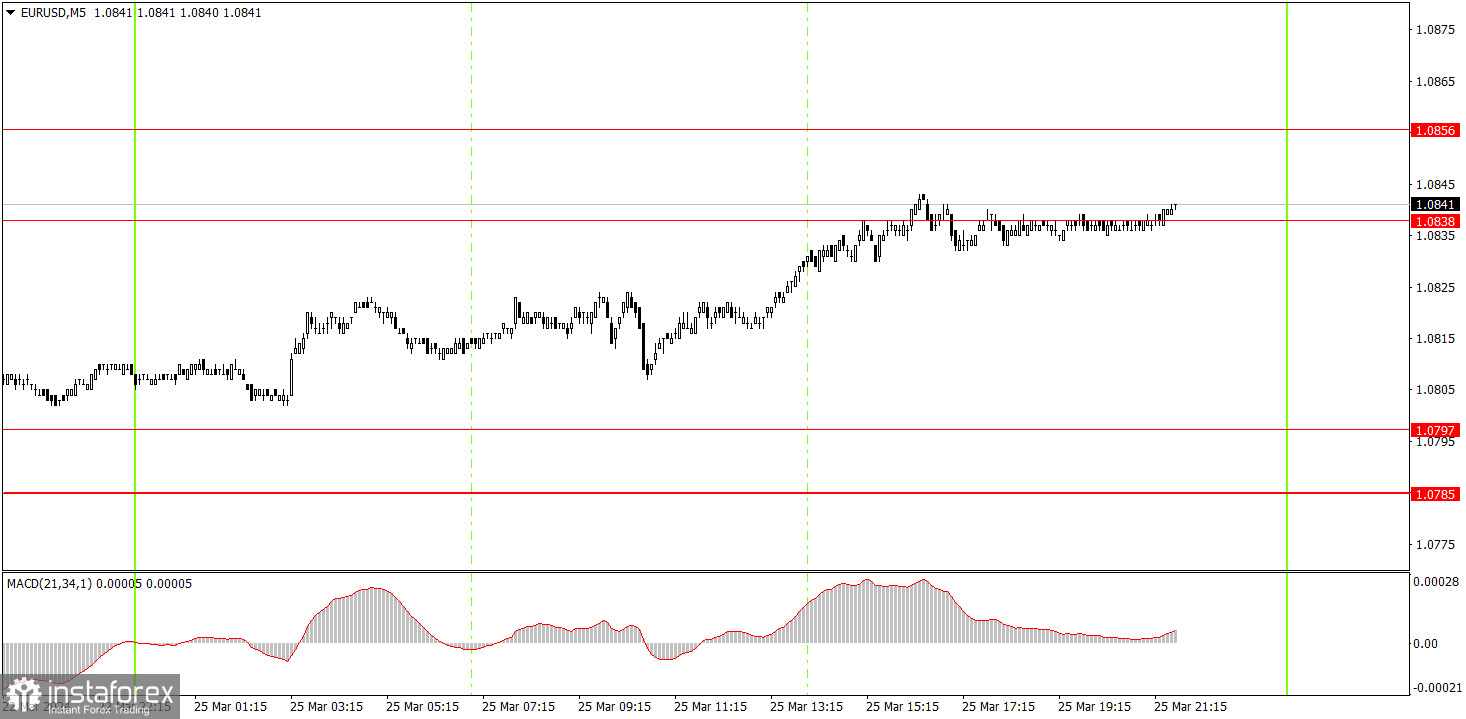
There were no trading signals on the 5-minute timeframe. As we mentioned, volatility was low, and the pair only managed to reach the level of 1.0838 during the US session, which is a new level that was not present on Monday. Therefore, beginners had no reason to enter the market. Throughout the current week, there will be very few reports and events, so low volatility may persist over the next four days.
On the hourly chart, EUR/USD continues to move downward, which corresponds to the fundamental background. We believe that the euro should fall anyway, as the price is still too high, and the global trend is downward. Unfortunately, the market doesn't always want to trade the pair in a logical manner, and from time to time, we observe unreasonable growth. However, corrections are still possible.
The key levels on the 5M chart are 1.0568, 1.0611-1.0618, 1.0668, 1.0725, 1.0785-1.0797, 1.0838, 1.0856, 1.0888-1.0896, 1.0940, 1.0971-1.0981, 1.1011, 1.1043, 1.1091. On Tuesday, there are no important events scheduled in the European Union. The US report on durable goods orders may provoke a market reaction. However, the pair is following a downtrend, so after the end of the corrective phase, we expect the euro to move downwards.
1) Signal strength is determined by the time taken for its formation (either a bounce or level breach). A shorter formation time indicates a stronger signal.
2) If two or more trades around a certain level are initiated based on false signals, subsequent signals from that level should be disregarded.
3) In a flat market, any currency pair can produce multiple false signals or none at all. In any case, the flat trend is not the best condition for trading.
4) Trading activities are confined between the onset of the European session and mid-way through the U.S. session, after which all open trades should be manually closed.
5) On the 30-minute timeframe, trades based on MACD signals are only advisable amidst substantial volatility and an established trend, confirmed either by a trendline or trend channel.
6) If two levels lie closely together (ranging from 5 to 15 pips apart), they should be considered as a support or resistance zone.
Support and Resistance price levels can serve as targets when buying or selling. You can place Take Profit levels near them.
Red lines represent channels or trend lines, depicting the current market trend and indicating the preferable trading direction.
The MACD(14,22,3) indicator, encompassing both the histogram and signal line, acts as an auxiliary tool and can also be used as a signal source.
Significant speeches and reports (always noted in the news calendar) can profoundly influence the price dynamics. Hence, trading during their release calls for heightened caution. It may be reasonable to exit the market to prevent abrupt price reversals against the prevailing trend.
Beginning traders should always remember that not every trade will yield profit. Establishing a clear strategy coupled with sound money management is the cornerstone of sustained trading success.
*A análise de mercado aqui postada destina-se a aumentar o seu conhecimento, mas não dar instruções para fazer uma negociação.
InstaSpot analytical reviews will make you fully aware of market trends! Being an InstaSpot client, you are provided with a large number of free services for efficient trading.


