


A lenda da equipe InstaSpot!
Lenda! Você acha que isso é retórica bombástica? Mas como devemos chamar um homem que se tornou o primeiro asiático a vencer o campeonato mundial de xadrez aos 18 anos e que se tornou o primeiro grande mestre indiano aos 19? Esse foi o começo de um caminho difícil para o título de campeão do mundo para Viswanathan Anand, o homem que se tornou parte da história do xadrez para sempre. Agora mais uma lenda na equipe InstaSpot!


O Borussia é um dos clubes de futebol com mais títulos da Alemanha, que provou repetidamente aos fãs: o espírito de competição e liderança certamente levará ao sucesso. Negocie da mesma maneira que os profissionais do esporte jogam: com confiança e ativamente. Mantenha o "ritmo" do Borussia FC e esteja na liderança com a InstaSpot!
Trend analysis (Fig. 1).
The GBP/USD currency pair may move downward from the level of 1.2654 (closing of yesterday's daily candle) to 1.2611, the historical support level (blue dotted line). In the case of testing this level, an upward movement is possible with a target of 1.2661, the 61.8% pullback level (yellow dotted line).
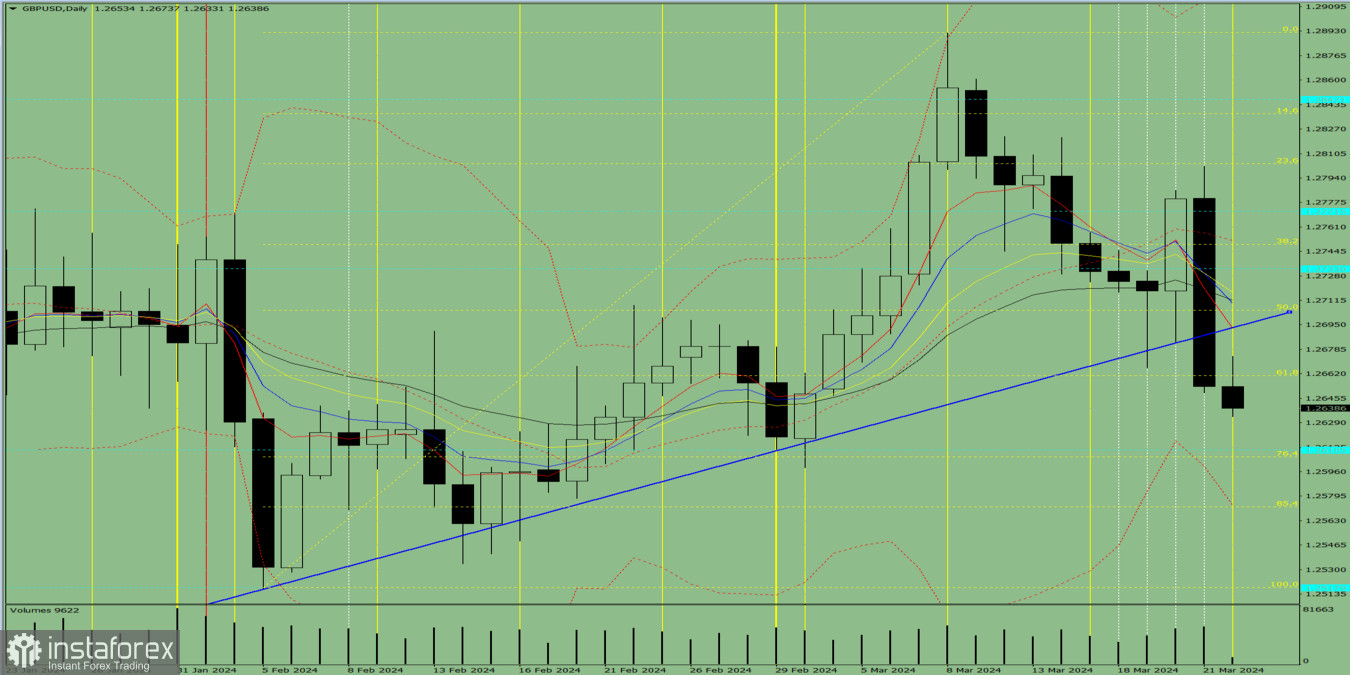
Fig. 1 (daily chart).
Comprehensive analysis:
General conclusion: Today, the price may move downward from the level of 1.2654 (closing of yesterday's daily candle) to 1.2611, the historical support level (blue dotted line). In the case of testing this level, an upward movement is possible with a target of 1.2661, the 61.8% pullback level (yellow dotted line).
Alternatively, from the level of 1.2654 (closing of yesterday's daily candle), the price may move downward to 1.2633 and then continue to move upward with a target of 1.2661, the 61.8% pullback level (yellow dotted line).
*A análise de mercado aqui postada destina-se a aumentar o seu conhecimento, mas não dar instruções para fazer uma negociação.
InstaSpot analytical reviews will make you fully aware of market trends! Being an InstaSpot client, you are provided with a large number of free services for efficient trading.


