


A lenda da equipe InstaSpot!
Lenda! Você acha que isso é retórica bombástica? Mas como devemos chamar um homem que se tornou o primeiro asiático a vencer o campeonato mundial de xadrez aos 18 anos e que se tornou o primeiro grande mestre indiano aos 19? Esse foi o começo de um caminho difícil para o título de campeão do mundo para Viswanathan Anand, o homem que se tornou parte da história do xadrez para sempre. Agora mais uma lenda na equipe InstaSpot!


O Borussia é um dos clubes de futebol com mais títulos da Alemanha, que provou repetidamente aos fãs: o espírito de competição e liderança certamente levará ao sucesso. Negocie da mesma maneira que os profissionais do esporte jogam: com confiança e ativamente. Mantenha o "ritmo" do Borussia FC e esteja na liderança com a InstaSpot!
Trend analysis (Fig. 1).
The EUR/USD currency pair may move upward from the level of 1.0864 (closing of yesterday's daily candle) to 1.0883, the 8-period EMA (blue thin line). In the case of testing this level, a continued upward movement is possible with a target at the 1.0909 resistance level (white thick line).
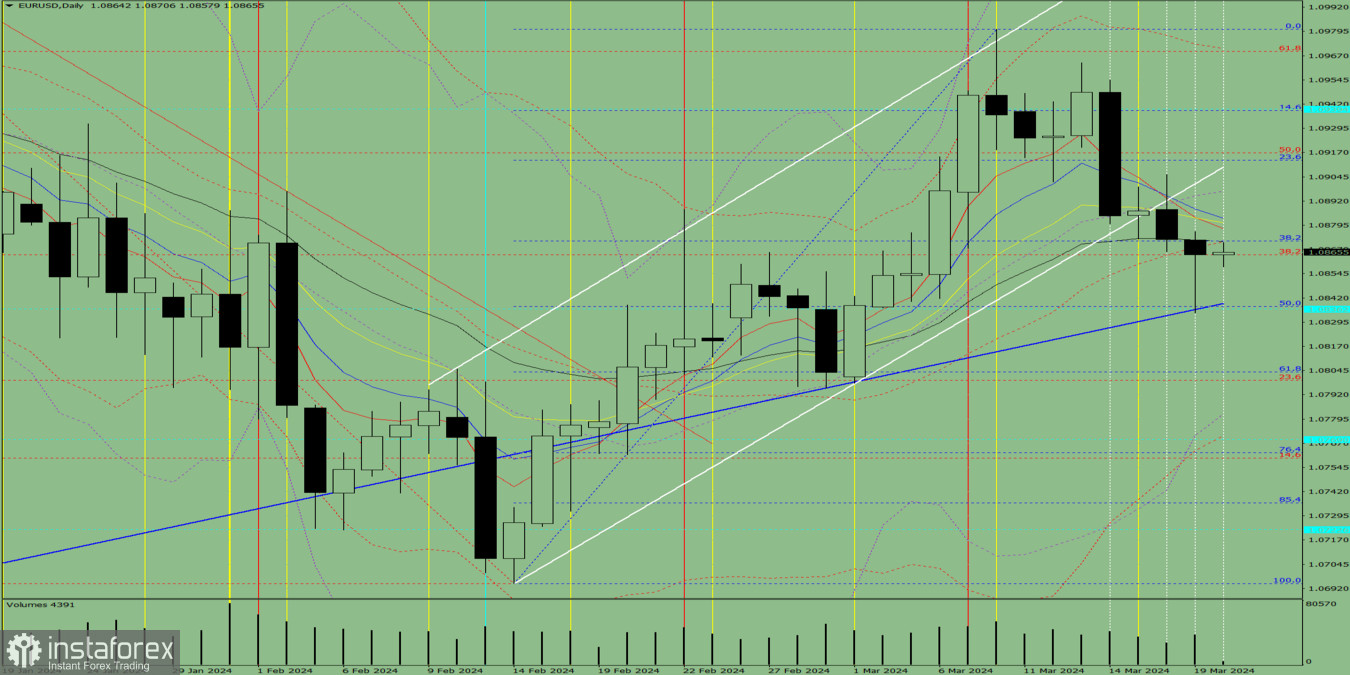
Fig. 1 (daily chart).
Comprehensive analysis:
General conclusion: Today, the price may move upward from the level of 1.0864 (closing of yesterday's daily candle) to 1.0883, the 8-period EMA (blue thin line). In the case of testing this level, a continued upward movement is possible with a target at the 1.0909 resistance level (white thick line).
Alternatively, from the level of 1.0864 (closing of yesterday's daily candle), the price may move upward to 1.0883, the 8-period EMA (blue thin line). In the case of testing this level, a downward movement is possible with a target at the 1.0839 support level (blue thick line).
*A análise de mercado aqui postada destina-se a aumentar o seu conhecimento, mas não dar instruções para fazer uma negociação.
InstaSpot analytical reviews will make you fully aware of market trends! Being an InstaSpot client, you are provided with a large number of free services for efficient trading.


