


Nossa equipe tem mais de 7,000,000 traders!
Todos os dias, trabalhamos juntos para melhorar a negociação. Obtivemos resultados elevados e avançamos.
O reconhecimento de milhões de traders em todo o mundo é a melhor apreciação do nosso trabalho! Você nos escolheu e faremos tudo o que for necessário para atender às suas expectativas!
Nós somos uma ótima equipe juntos!
InstaSpot. Orgulho de trabalhar para você!


Ator, hexacampeão do UFC e um verdadeiro herói!
Um homem de sucesso. Um homem que mostra o nosso caminho.
O segredo por trás do sucesso de Taktarov é um movimento constante em direção ao objetivo.
Revele todos os lados do seu talento!
Descubra, tente, falhe, mas nunca pare!
I InstaSpot. Sua história de sucesso começa aqui!
Trend analysis (Fig. 1).
The EUR/USD currency pair may move upward from the level of 1.0887 (closing of Friday's daily candlestick) to 1.0917, the 50% pullback level (red dotted line). In the case of testing this level, a continued upward movement is possible with a target of 1.0939, the historical resistance level (blue dotted line).
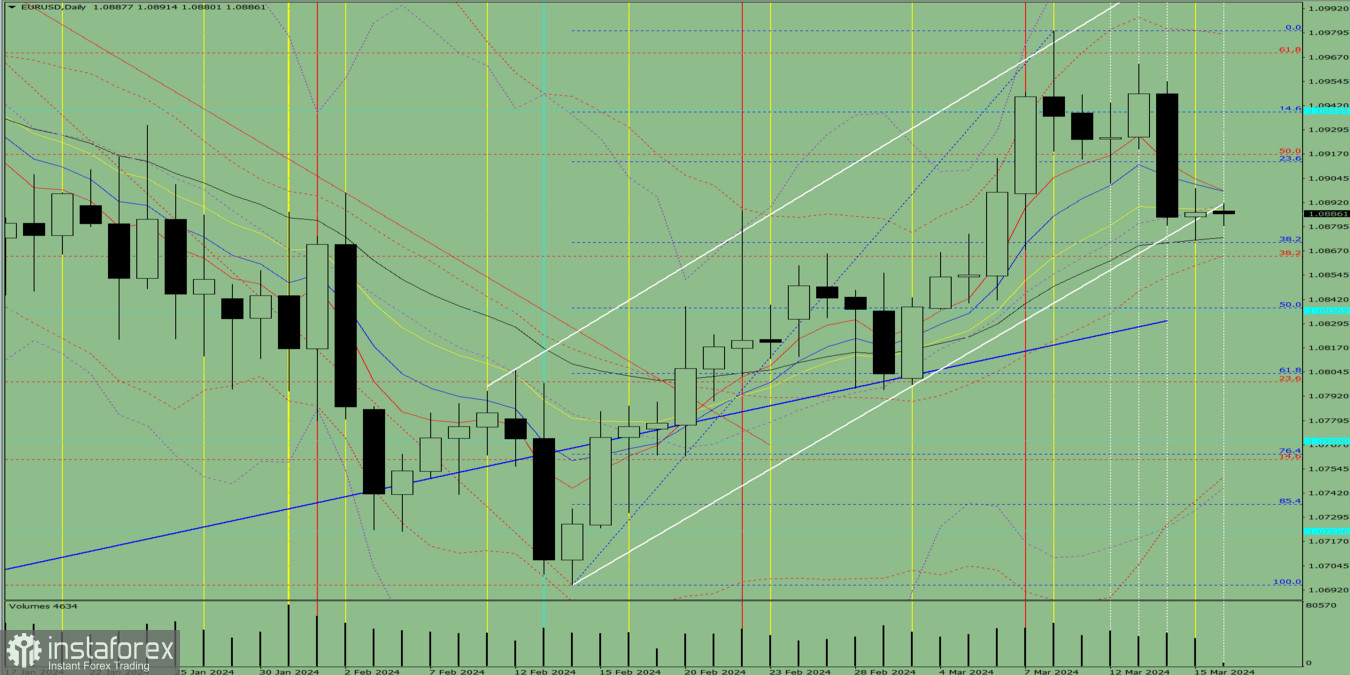
Fig. 1 (daily chart).
Comprehensive analysis:
Today, the price may move upward from the level of 1.0887 (closing of Friday's daily candlestick) to 1.0917, the 50% pullback level (red dotted line). In the case of testing this level, a continued upward movement is possible with a target of 1.0939, the historical resistance level (blue dotted line).
Alternatively, from the level of 1.0887 (closing of Friday's daily candlestick), the price may move downward to 1.0871, the 38.2% pullback level (blue dotted line). In the case of testing this level, an upward movement is possible to 1.0917, the 50% pullback level (red dotted line).
*A análise de mercado aqui postada destina-se a aumentar o seu conhecimento, mas não dar instruções para fazer uma negociação.
InstaSpot analytical reviews will make you fully aware of market trends! Being an InstaSpot client, you are provided with a large number of free services for efficient trading.


