


Nossa equipe tem mais de 7,000,000 traders!
Todos os dias, trabalhamos juntos para melhorar a negociação. Obtivemos resultados elevados e avançamos.
O reconhecimento de milhões de traders em todo o mundo é a melhor apreciação do nosso trabalho! Você nos escolheu e faremos tudo o que for necessário para atender às suas expectativas!
Nós somos uma ótima equipe juntos!
InstaSpot. Orgulho de trabalhar para você!


Ator, hexacampeão do UFC e um verdadeiro herói!
Um homem de sucesso. Um homem que mostra o nosso caminho.
O segredo por trás do sucesso de Taktarov é um movimento constante em direção ao objetivo.
Revele todos os lados do seu talento!
Descubra, tente, falhe, mas nunca pare!
I InstaSpot. Sua história de sucesso começa aqui!
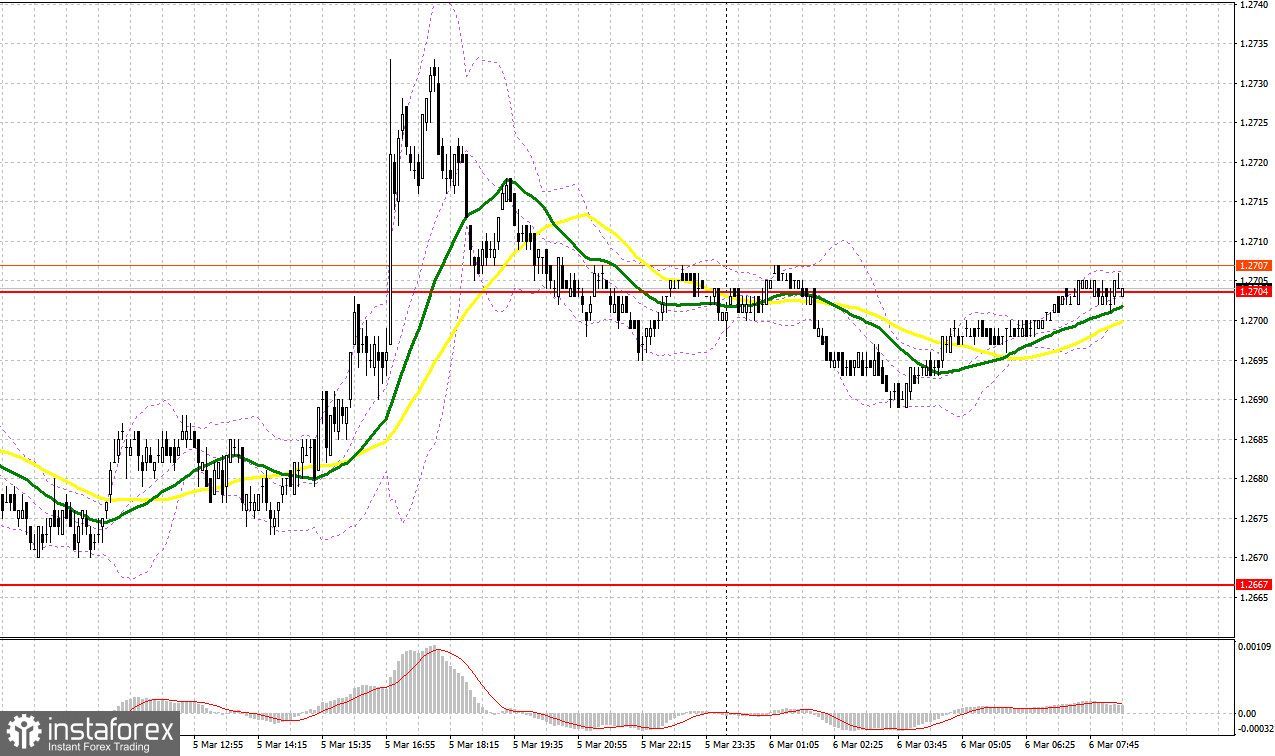
Yesterday, traders received no signals to enter the market. Let's take a look at the 5-minute chart and see what happened. Earlier, I paid attention to the level of 1.2667 to decide when to enter the market. Although the price dropped, there was no false breakout of 1.2667. In the second part of the day, the situation repeated. I failed to get an entry signal despite a break of 1.2704.
Conditions for opening long positions on GBP/USD:
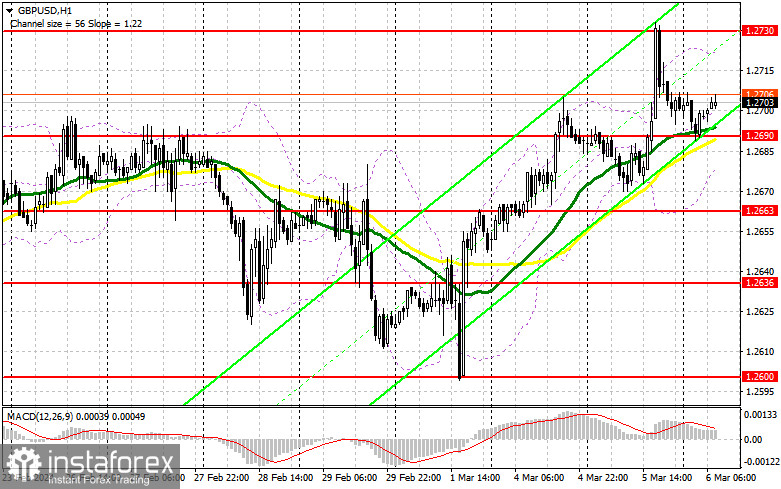
Yesterday, very weak US data was another driver for a rise in the British pound, allowing buyers to take control over the market. Today, the UK will publish its construction PMI and annual budget figures. It is difficult to say how the pound will react to these figures, but I would prefer to act after a decline and a false breakdown close to the nearest support at 1.2690, formed later yesterday. This will give a good entry point for long positions in the expectation of further recovery of the pair to the area of 1.2730. It is a new resistance level, where buyers are sure to face serious problems. A breakout and consolidation above this range will strengthen the demand for the pound and open the way to 1.2769, which will boost bulls' positions, thus intensifying the uptrend. The farthest target is seen at the high of 1.2797, where I am going to take a profit. In case of a decline and a lack of bullish activity at 1.2690, the pound may lose ground. In this case, only a false breakdown near the next support at 1.2663 will confirm the correct entry point. I plan to buy GBP/USD just after a rebound from the low of 1.2636, expecting a rise of 30–35 pips within the day.
Conditions for opening short positions on GBP/USD:
Yesterday, bears did their best to prevent the development of the bullish trend, and they succeeded. Today, I am waiting for the reaction to the UK data, but before selling, I would like to make sure that there are big players in the market. A false breakdown at 1.2730 will be a great confirmation, which will lead to selling with the target of a downward correction and a decline to 1.2690. A breakout and an upward test of this range will deal a blow to bulls' positions, opening the way to 1.2663, where I expect big buyers to show up. The farthest target will be the area of 1.2636, where they will fix profits. If GBP/USD grows and there is no activity at 1.2730, buyers will feel the strength again in the expectation of an uptrend return. In this case, I will postpone selling until there is a false breakdown at 1.2769. If there is no downside movement there, I will sell GBP/USD just after a bounce from 1.2797, in anticipation of the pair declining by 30-35 pips intraday.
COT report
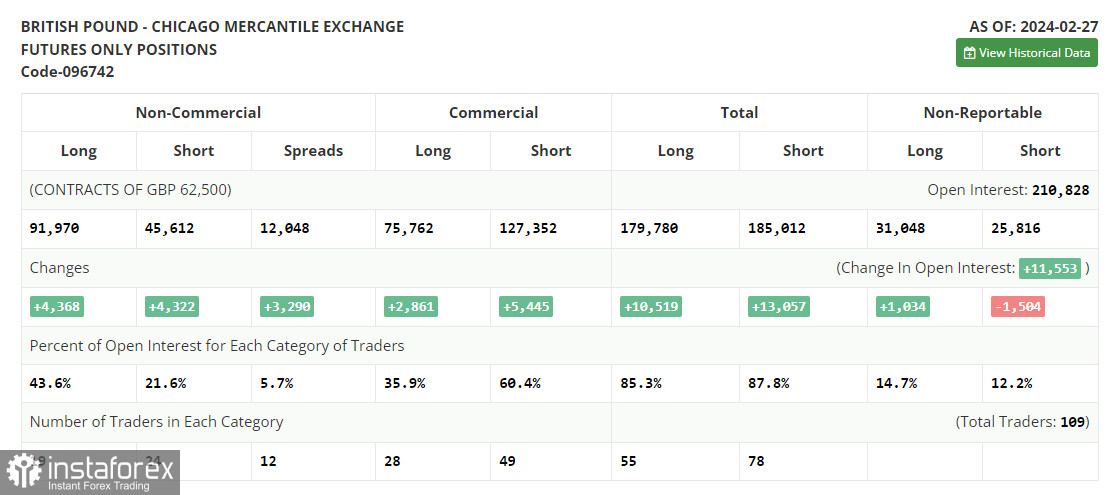
According to the COT report (Commitment of Traders) for February 27, the number of both short and long positions increased. The latest inflation data and the statements of the Bank of England's officials that rates could be lowered even if inflation fails to reach the 2.0% target have become of secondary importance. Now, a lot will depend on the position of the Federal Reserve. US policymakers are concerned about the fact that inflation is no longer coming down as much as they would like, which could lengthen the cycle of high interest rates until late summer this year. This all is capping the pound's appreciation, thus boosting the US dollar. The latest COT report unveiled that long non-commercial positions rose by 4,368 to 91,970, while short non-commercial positions jumped by 4,322 to 45,612. As a result, the spread between long and short positions increased by 3,290.
Indicators' signals
Moving averages
The instrument is trading above the 30 and 50-day moving averages, which points to a possible rise in the pound sterling.
Note: The period and prices of the moving averages are considered by the analyst on the 1-hour chart and differ from the general definition of classic daily moving averages on the daily chart.
Bollinger Bands
If the pair declines, the lower limit, located at 1.2670, will act as support.
Description of indicators
*A análise de mercado aqui postada destina-se a aumentar o seu conhecimento, mas não dar instruções para fazer uma negociação.
InstaSpot analytical reviews will make you fully aware of market trends! Being an InstaSpot client, you are provided with a large number of free services for efficient trading.


