


A lenda da equipe InstaSpot!
Lenda! Você acha que isso é retórica bombástica? Mas como devemos chamar um homem que se tornou o primeiro asiático a vencer o campeonato mundial de xadrez aos 18 anos e que se tornou o primeiro grande mestre indiano aos 19? Esse foi o começo de um caminho difícil para o título de campeão do mundo para Viswanathan Anand, o homem que se tornou parte da história do xadrez para sempre. Agora mais uma lenda na equipe InstaSpot!


O Borussia é um dos clubes de futebol com mais títulos da Alemanha, que provou repetidamente aos fãs: o espírito de competição e liderança certamente levará ao sucesso. Negocie da mesma maneira que os profissionais do esporte jogam: com confiança e ativamente. Mantenha o "ritmo" do Borussia FC e esteja na liderança com a InstaSpot!
For long positions on EUR/USD
Yesterday, the Federal Reserve minutes stopped the dollar from strengthening and the euro from falling. According to the December meeting, the committee members are confident that rates will start to gradually decline in 2024, which will weaken the U.S. dollar in the medium term, making risk assets, including the euro, more attractive. Today, there are some rather curious eurozone reports, which could mount pressure on the euro. Market participants will monitor the Services PMI data of the eurozone countries, as well as the composite PMI index. The German Consumer Price Index will be quite interesting as well. If all the reports show a decline, this might have a negative impact on the euro. Therefore, I will act on a decline after a false breakout near the nearest support at 1.0897. This will create a good entry point into long positions with the goal of pushing the pair to rise to the resistance area of 1.0935, which is in line with the bearish moving averages. A breakout and a downward test of this range will produce a buy signal, offering a chance to support the bullish correction and the prospect of testing 1.0964. The furthest target would be a high at 1.1004, where I plan to take profits. If EUR/USD declines and there is no activity at 1.0897 in the first half of the day, the pair will remain under pressure at the beginning of the year, which will lead to a larger downward movement. In this case, it will be possible to enter the market after forming a false breakout near 1.0867. I will open long positions immediately on a rebound from 1.0834, bearing in mind an upward correction of 30-35 pips within the day.
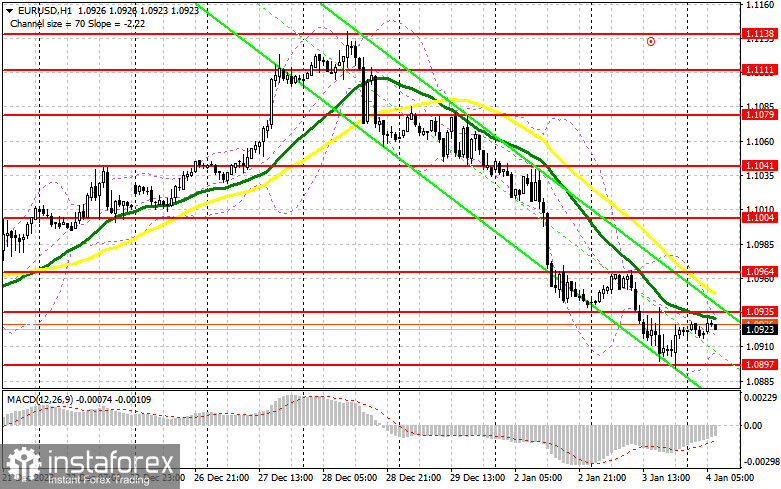
For short positions on EUR/USD:
Sellers are in control of the market, but the Fed minutes spoiled the picture. Weak eurozone data should help improve the bears' position. Of course, it would be nice to see the pair rise and form a false breakout at 1.0935, which was established yesterday. An unsuccessful consolidation on this mark will indicate the bears' presence in the market, which may push the price to the area of 1.0897, where the bulls were also active yesterday. Only after a breakout and consolidation below this range, as well as an upward retest, do I expect another sell signal at 1.0867. A test of this level will extend the correction at the beginning of the year. The lowest target will be 1.0834, where I will take profits. In case of an upward movement of EUR/USD amid good eurozone data, and bears are not active at 1.0935, the pressure on the pair will weaken. In this case, I will postpone selling the pair until the price tests the next resistance at 1.0964. There, selling is also possible but only after a false breakout. I will open short positions immediately on a rebound from 1.1004 aiming for a downward correction of 30-35 pips.
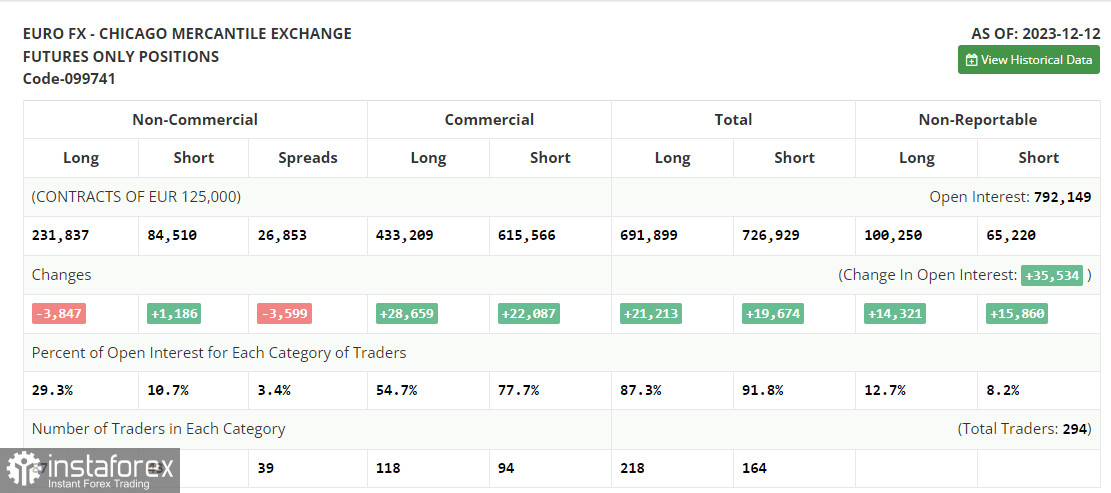
COT report:
The COT report for December 12 indicates a decrease in long positions and an increase in short ones. Obviously, the Federal Reserve's December meeting and its sudden pivot together with the European Central Bank's tough stance had a minor effect on the positioning of major players, as buyers of risky assets clearly have the advantage. A number of reports related to inflation in the eurozone and the US will be released soon, which will throw light on the Fed's stance on 2024. But whatever the data, we will expect further growth from the euro in the medium term. The COT report indicated that long non-commercial positions fell by 3,847 to 231,837, while short non-commercial positions increased by 1,186 to 84,510. As a result, the spread between long and short positions decreased by 3,599.
Indicator signals:
Moving averages:
Trading below the 30- and 50-day moving averages indicates a correction.
Please note that the time period and levels of the moving averages are analyzed only for the H1 chart, which differs from the general definition of the classic daily moving averages on the D1 chart.
Bollinger Bands
If EUR/USD declines, the indicator's lower border near 1.0897 will serve as support.
Description of indicators:
• A moving average of a 50-day period determines the current trend by smoothing volatility and noise; marked in yellow on the chart;
• A moving average of a 30-day period determines the current trend by smoothing volatility and noise; marked in green on the chart;
• MACD Indicator (Moving Average Convergence/Divergence) Fast EMA with a 12-day period; Slow EMA with a 26-day period. SMA with a 9-day period;
• Bollinger Bands: 20-day period;
• Non-commercial traders are speculators such as individual traders, hedge funds, and large institutions who use the futures market for speculative purposes and meet certain requirements;
• Long non-commercial positions represent the total number of long positions opened by non-commercial traders;
• Short non-commercial positions represent the total number of short positions opened by non-commercial traders;
• The non-commercial net position is the difference between short and long positions of non-commercial traders.
*A análise de mercado aqui postada destina-se a aumentar o seu conhecimento, mas não dar instruções para fazer uma negociação.
InstaSpot analytical reviews will make you fully aware of market trends! Being an InstaSpot client, you are provided with a large number of free services for efficient trading.


