


A lenda da equipe InstaSpot!
Lenda! Você acha que isso é retórica bombástica? Mas como devemos chamar um homem que se tornou o primeiro asiático a vencer o campeonato mundial de xadrez aos 18 anos e que se tornou o primeiro grande mestre indiano aos 19? Esse foi o começo de um caminho difícil para o título de campeão do mundo para Viswanathan Anand, o homem que se tornou parte da história do xadrez para sempre. Agora mais uma lenda na equipe InstaSpot!


O Borussia é um dos clubes de futebol com mais títulos da Alemanha, que provou repetidamente aos fãs: o espírito de competição e liderança certamente levará ao sucesso. Negocie da mesma maneira que os profissionais do esporte jogam: com confiança e ativamente. Mantenha o "ritmo" do Borussia FC e esteja na liderança com a InstaSpot!
Trend analysis
This week, GBP/USD may continue moving upward from the level of 1.2694 (closing price of the last weekly candle) to the resistance line at 1.2895 (thick blue line). Upon testing this price, it may turn around and fall to the 61.8% retracement level of 1.2746 (red dashed line).
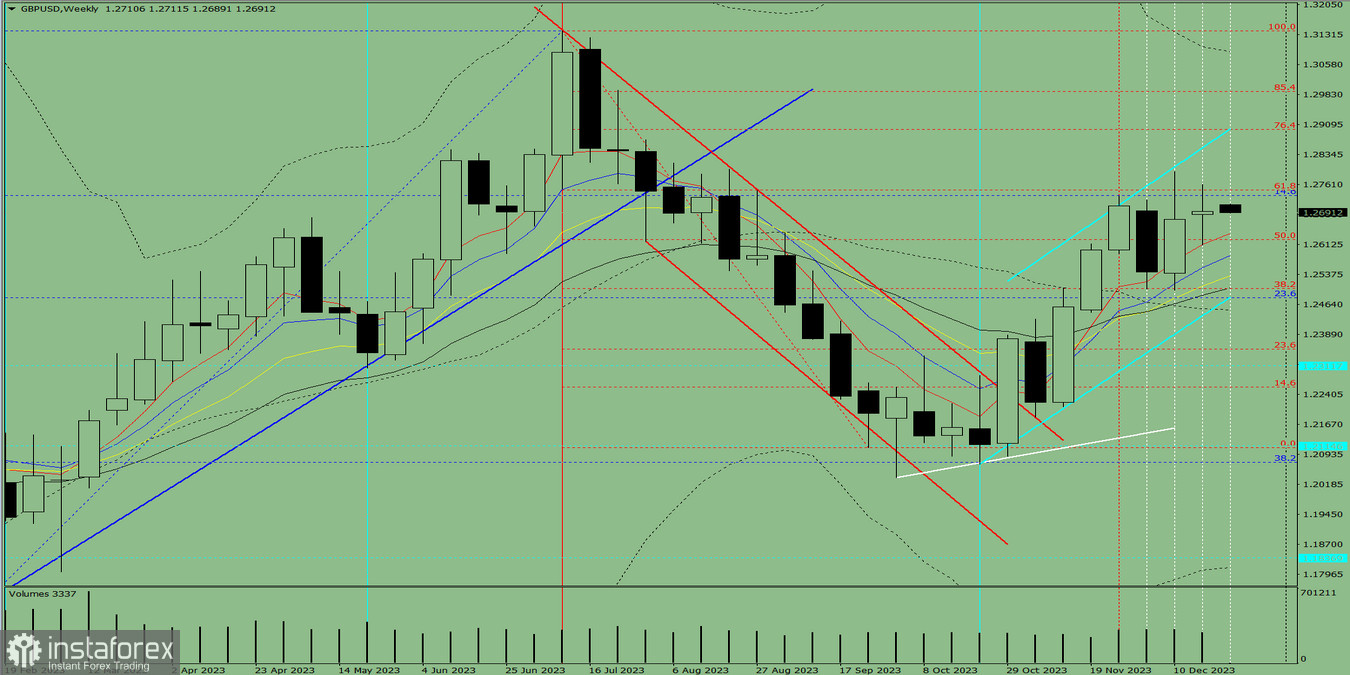
Fig. 1 (weekly chart)
Comprehensive analysis:
Indicator analysis - upward
Fibonacci levels - upward
Volumes - upward
Candlestick analysis - upward
Trend analysis - upward
Bollinger bands - upward
Monthly chart - upward
Conclusion: The indicators point to an upward movement in GBP/USD.
Overall conclusion: The pair will have a bullish trend, with no first lower shadow on the weekly white candle (Tuesday - upward) and no second upper shadow (Friday - upward).
So during the week, pound will rise from 1.2694 (closing price of the last weekly candle) to the resistance line at 1.2895 (thick blue line), and then turn around and decline to the 61.8% retracement level of 1.2746 (red dashed line).
Alternatively, it could climb from 1.2694 (closing price of the last weekly candle) to the upper fractal at 1.2793 (weekly candle from December 10, 2023), followed by a downward movement to the 61.8% retracement level of 1.2746 (red dashed line).
*A análise de mercado aqui postada destina-se a aumentar o seu conhecimento, mas não dar instruções para fazer uma negociação.
InstaSpot analytical reviews will make you fully aware of market trends! Being an InstaSpot client, you are provided with a large number of free services for efficient trading.


